Dovydas Bykovas7 min read
How to Securely Connect PostgreSQL to Oxynote for Live Charts
This guide sets up a read-only PostgreSQL role, connects it to Oxynote as a data source and builds live charts from your own tables.
Oxynote charts can query your PostgreSQL database directly, so a page can show live numbers from your app's own tables. To keep that safe, Oxynote only accepts an account that can't write.
This is about your database as a data source for charts. Oxynote's own data, its pages and settings, lives in a separate PostgreSQL inside the container. To move that to an external database instead, see the operator README.
This guide covers creating a read-only role, connecting it to Oxynote and three example pages built on it.
What You Need
- Oxynote, running. See the install guide.
- A PostgreSQL database that Oxynote's container can reach over the network.
psqlaccess as a superuser or as the database owner, to create a role.
The examples use a database called bookings, whose tables belong to booking_app, the role its application runs as. Swap in your own names.
Create a Read-Only Role
Start with the role and its defaults. Run this in psql as a superuser:
-- the role Oxynote signs in as
CREATE ROLE oxynote_reader LOGIN PASSWORD 'change-me';

-- every transaction this role starts is read-only
ALTER ROLE oxynote_reader SET default_transaction_read_only = on;

-- stop a slow query before Oxynote gives up on it
ALTER ROLE oxynote_reader SET statement_timeout = '5s';

GRANT CONNECT ON DATABASE bookings TO oxynote_reader;
Oxynote stops a query after 10 seconds anyway. A lower timeout on the role makes a slow chart fail sooner, so pick whatever suits your database.
Table permissions belong to each database, so connect to bookings and let the role read its tables:
\c bookings

GRANT USAGE ON SCHEMA public TO oxynote_reader;
GRANT SELECT ON ALL TABLES IN SCHEMA public TO oxynote_reader;

-- tables booking_app creates later are readable too
ALTER DEFAULT PRIVILEGES FOR ROLE booking_app IN SCHEMA public
  GRANT SELECT ON TABLES TO oxynote_reader;
Tables Created Later
ALTER DEFAULT PRIVILEGES only covers tables created by the role named in FOR ROLE. If your migrations run as another role, a superuser for example, name that one too. Otherwise Oxynote gets permission denied on the next new table.
On PostgreSQL 14 and newer, there is a shorter way:
GRANT pg_read_all_data TO oxynote_reader;
It reads every table and view in every schema, including the ones anyone creates later. The downside is that it also reads tables like users and sessions. If a table holds personal data, keep the narrow grants and give Oxynote a view with only the columns your charts need.
PostgreSQL 14 and Older
Up to PostgreSQL 14, every role could create tables in the public schema, oxynote_reader included. Revoke it from everyone, then grant it back to the role that runs your migrations:
REVOKE CREATE ON SCHEMA public FROM PUBLIC;
GRANT CREATE ON SCHEMA public TO booking_app;
Or Point It at a Replica
Oxynote also accepts a read replica. A replica refuses every write and keeps chart queries off your primary. If you have one, connect Oxynote to it, and still grant SELECT only on the tables your charts need.
Why the Grants Matter
When you connect a data source, only the grants can ensure that its account won't be able to write. The read-only setting can't, because it's only a default, and any session can change its own defaults. Here is oxynote_reader turning the setting off and then trying to add a row, on PostgreSQL 17:
SET default_transaction_read_only = off;
-- SET

INSERT INTO quotes (id, created_at, lane, status)
VALUES (1000, now(), 'Rotterdam → Gdańsk', 'booked');
-- ERROR:  permission denied for table quotes
The SET goes through, but the INSERT still fails, and so do TRUNCATE and DROP TABLE. The grants stop them, not the setting.
Anyone who can edit a chart's query in your workspace can run that SET, and so can any AI agent you connect over MCP. The grants are the boundary. Keep the setting anyway, as a second layer behind them.
Connect It in Oxynote
Open Settings, go to External Data Sources and click Connect next to PostgreSQL. Then fill in the form:
- Data Source Nickname: the name pages show, such as
Bookings. - Data Source URL:
postgresql://<host>:5432/bookings. When the database is on another machine, add?sslmode=require. - Auth Username and Auth Password:
oxynote_readerand its password. - CA Certificate, optional: when your database's certificate is signed by your own CA, paste that CA here. Oxynote then trusts only it and always connects over TLS.
The host is where Oxynote's container finds the database, and localhost there means the container itself, not your machine:
- If PostgreSQL runs in Docker on the same network as Oxynote, such as in the same Compose file, use its service name. The screenshots below use
postgres. - If it runs on the same machine as Oxynote but outside Docker, use
host.docker.internal. Docker Desktop on Mac and Windows provides that name. On Linux, add--add-host=host.docker.internal:host-gatewayto Oxynote'sdocker run. PostgreSQL also has to accept connections from the container, whichlisten_addressesinpostgresql.confand the rules inpg_hba.confcontrol. - Anywhere else, use its hostname.
Test & Save checks that the account can't write before anything is saved. Try it with booking_app instead, and Oxynote refuses it:
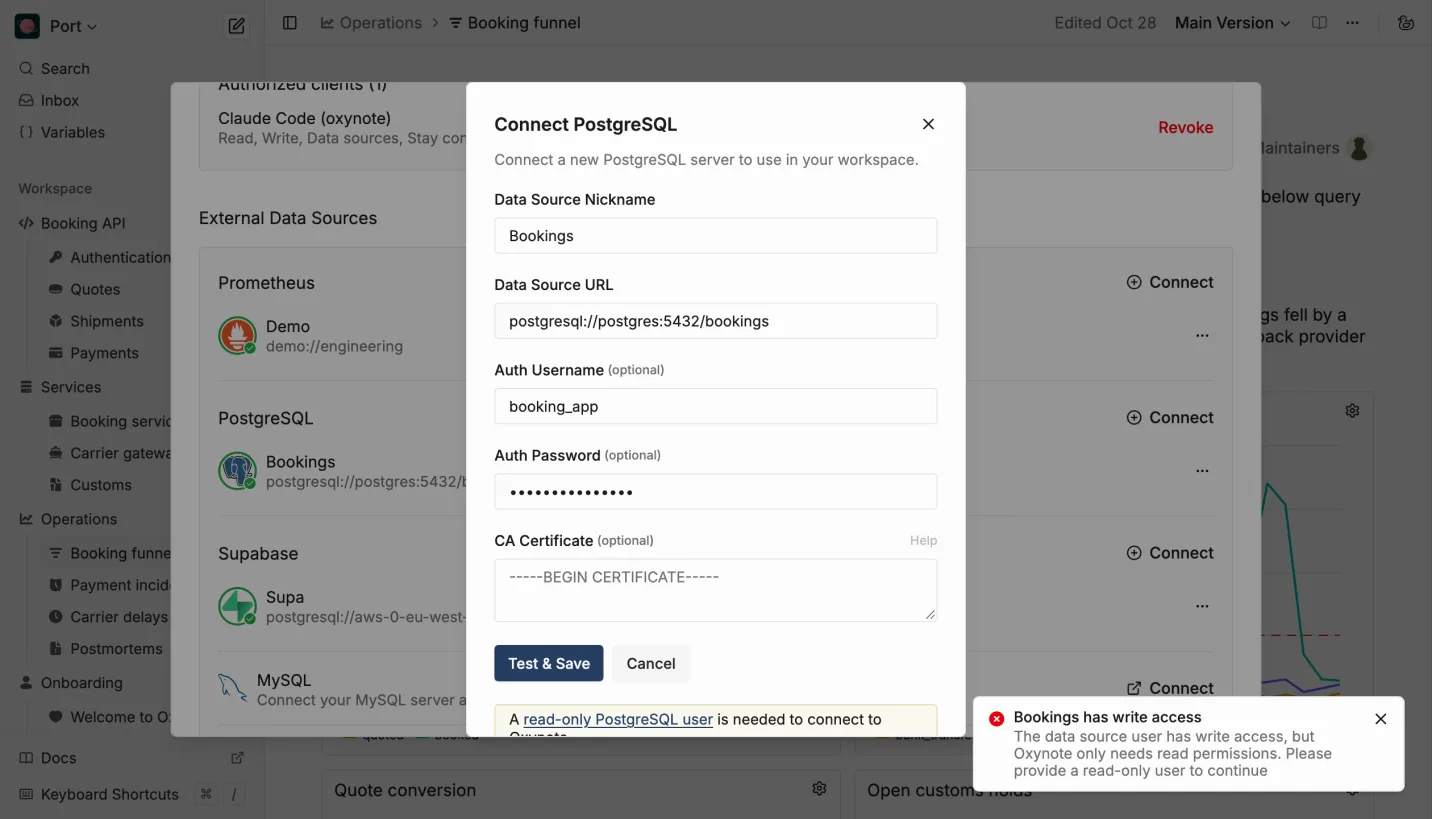
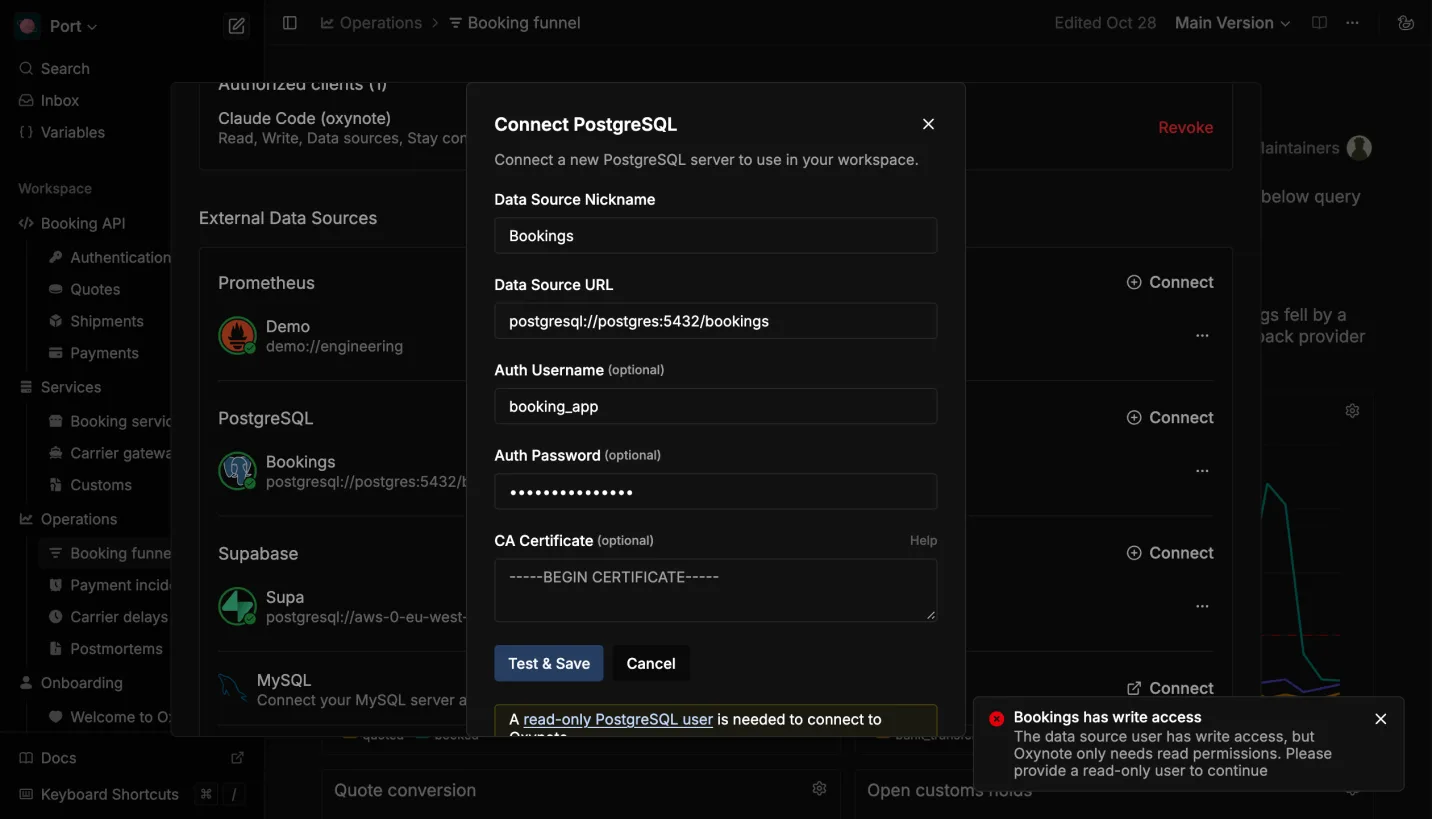 booking_app can write, so Oxynote refuses it
With oxynote_reader, the test passes and the data source joins the list with a green tick:
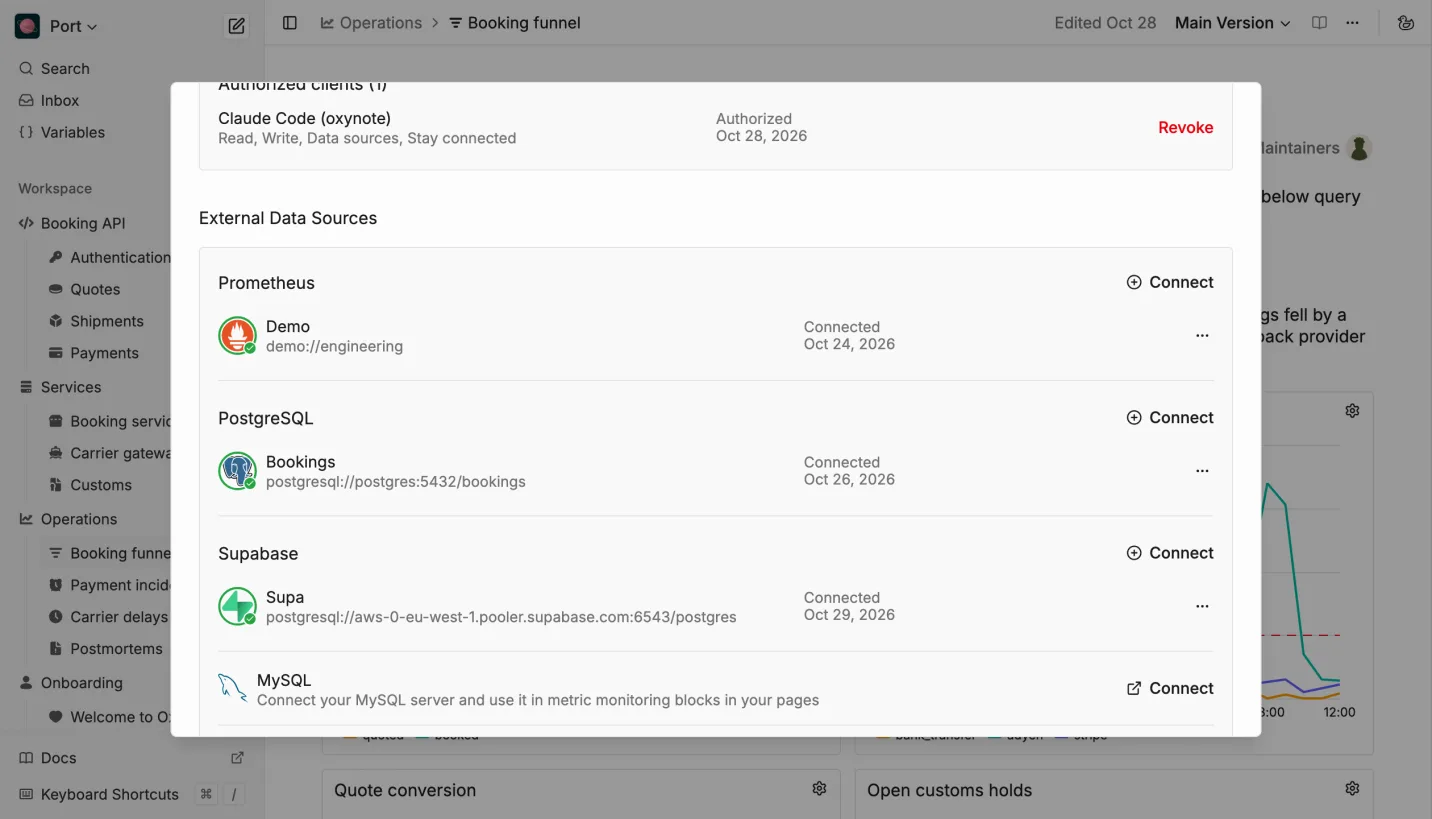
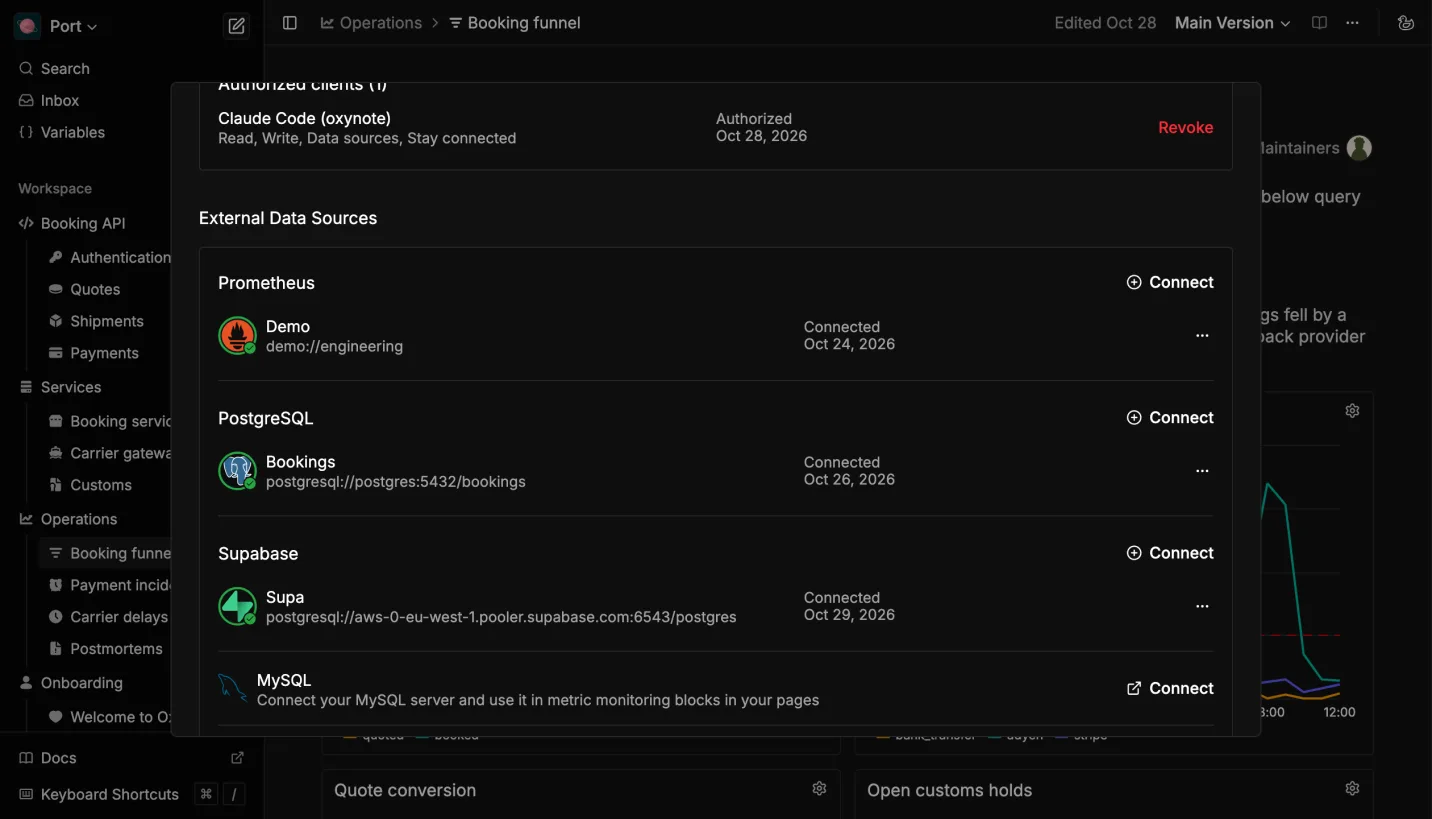 Bookings, connected through the read-only role
Draw the First Chart
On any page, type / and choose Live Metrics. Pick the data source, then write a query that returns a time column and one or more numbers:
SELECT
  $__timeGroupAlias(created_at, '1h'),
  provider,
  avg((status = 'failed')::int) * 100 AS failure_rate
FROM payment_attempts
WHERE $__timeFilter(created_at)
GROUP BY 1, provider
ORDER BY 1
The two $__ macros handle the time range. $__timeFilter(created_at) keeps the rows inside the chart's time range, and $__timeGroupAlias(created_at, '1h') buckets them by hour into a column named time. If you've used Grafana's PostgreSQL data source, they will look familiar, because they follow its names.
The provider column splits the result into one line per payment provider. Setting the Legend field to {{provider}} names each line after it.
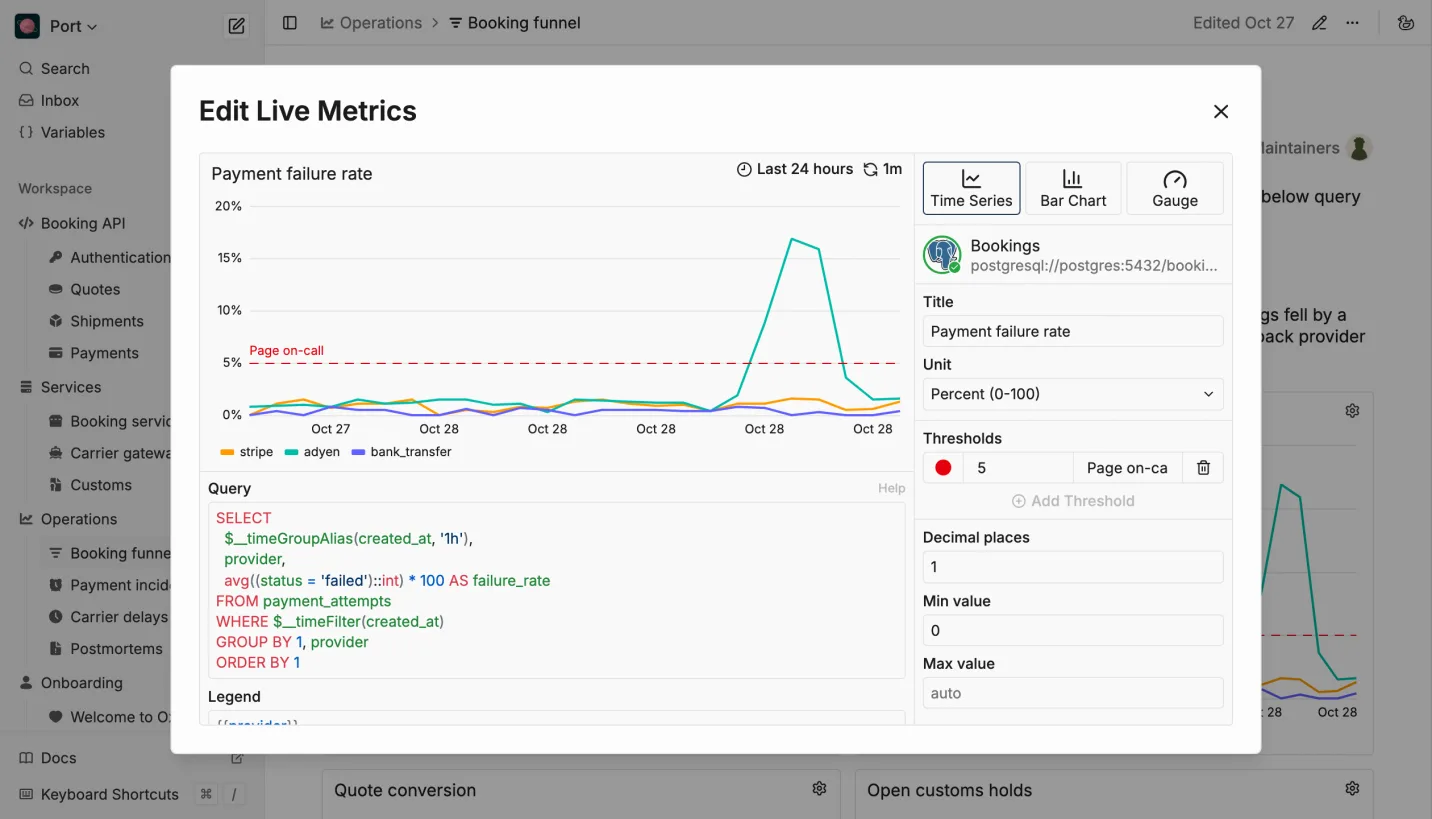
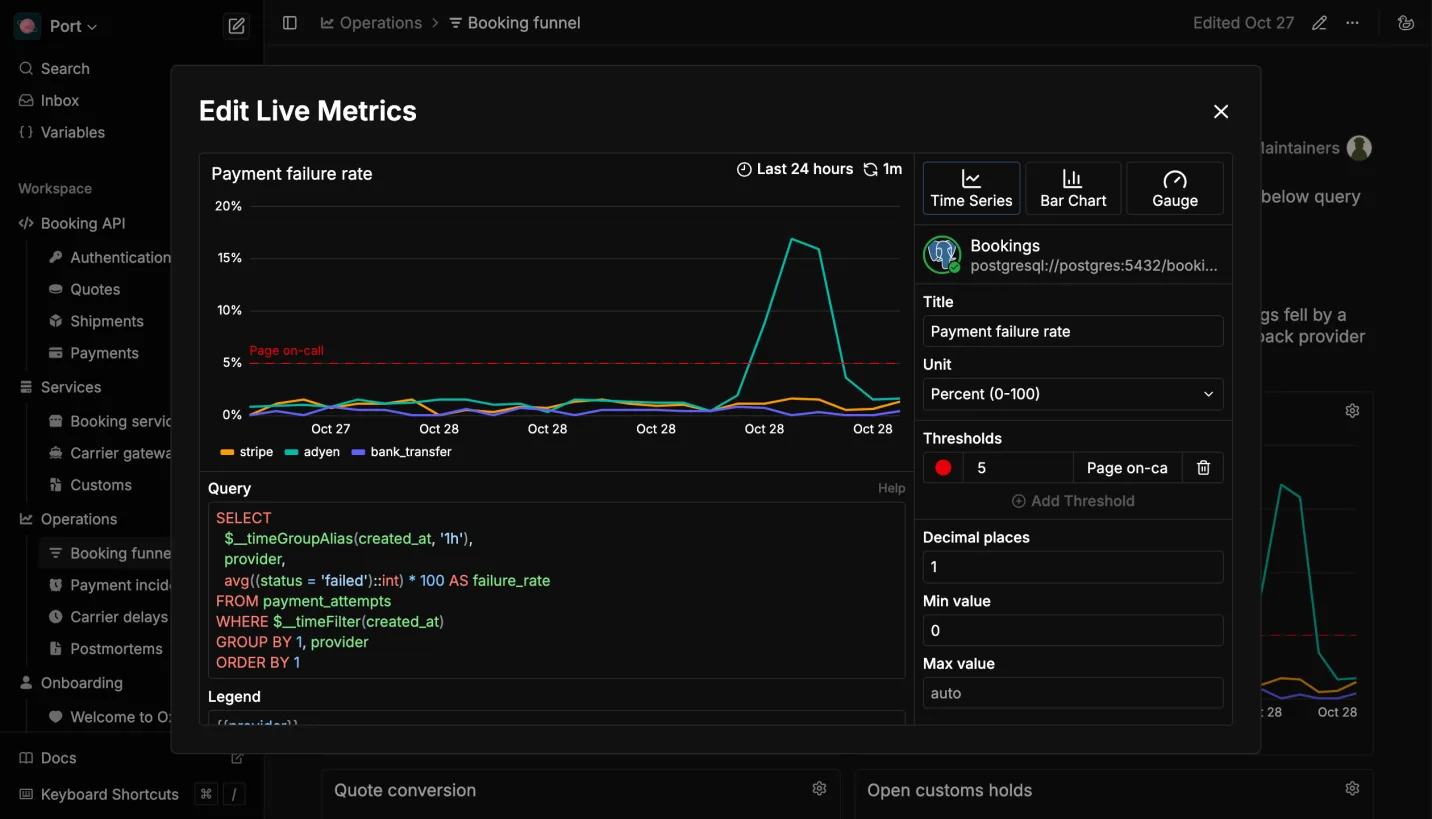 The query, the chart it draws and a threshold at 5%
The chart runs its query when someone opens the page and again at its refresh interval, every minute here.
Three Pages Worth Building
The screenshots come from a demo workspace for Port, a made-up freight booking platform. Its Postgres holds a month of fake quotes, payments, carrier webhooks and customs holds.
A Runbook With Its Evidence
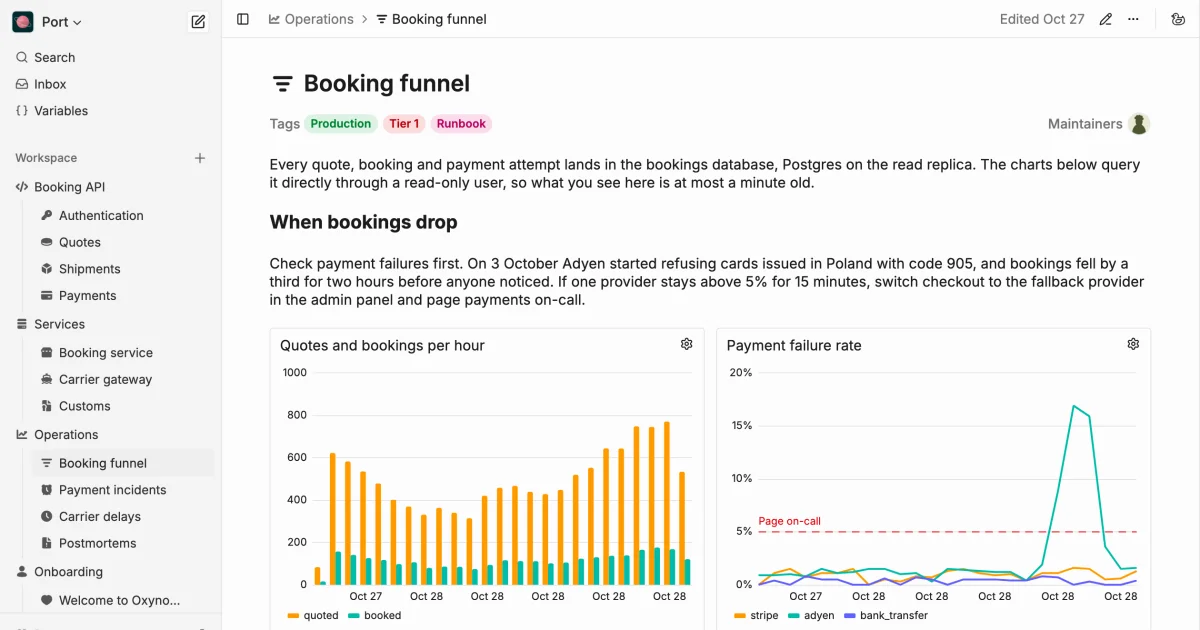
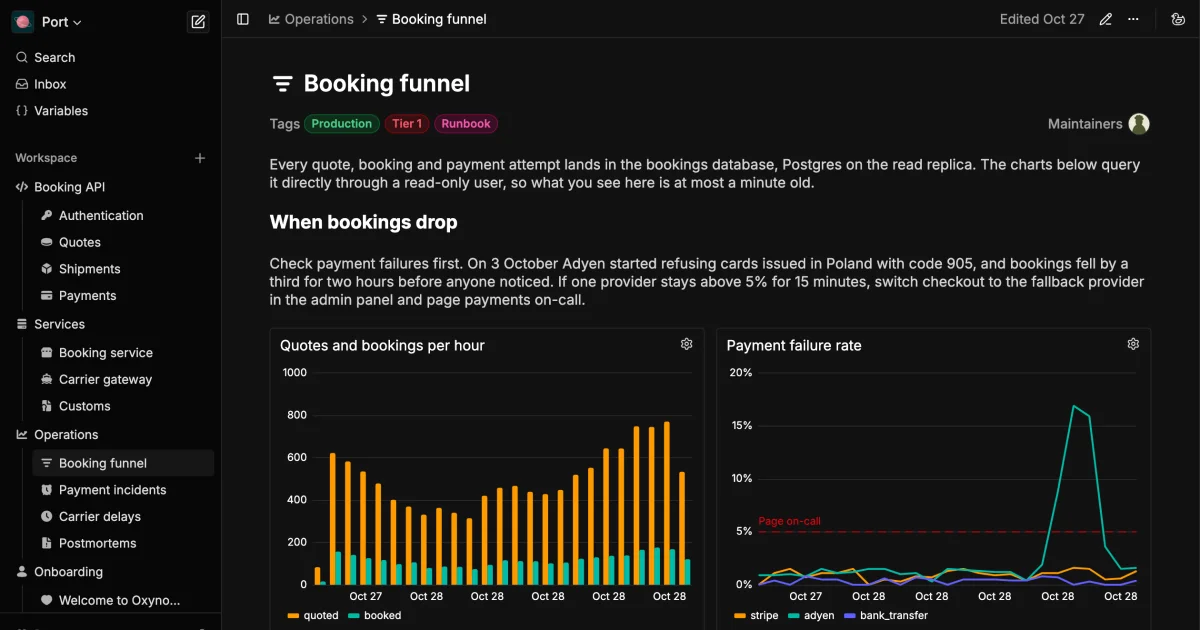
Port's booking funnel page says what to do when bookings drop: check payment failures first, and if one provider stays above 5% for 15 minutes, switch checkout to the fallback provider. The payment failure chart sits right under that sentence, with the 5% line drawn in.
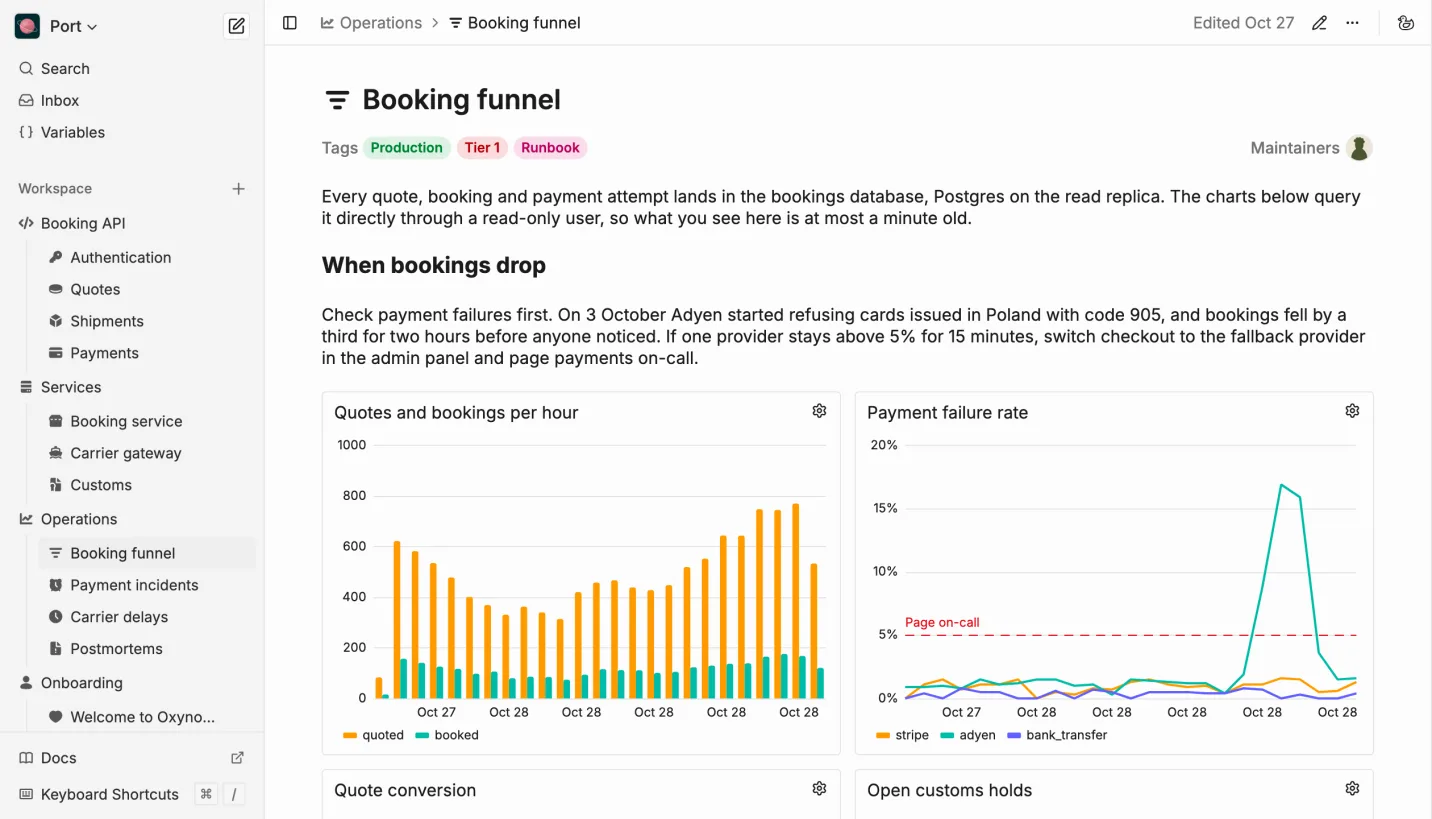
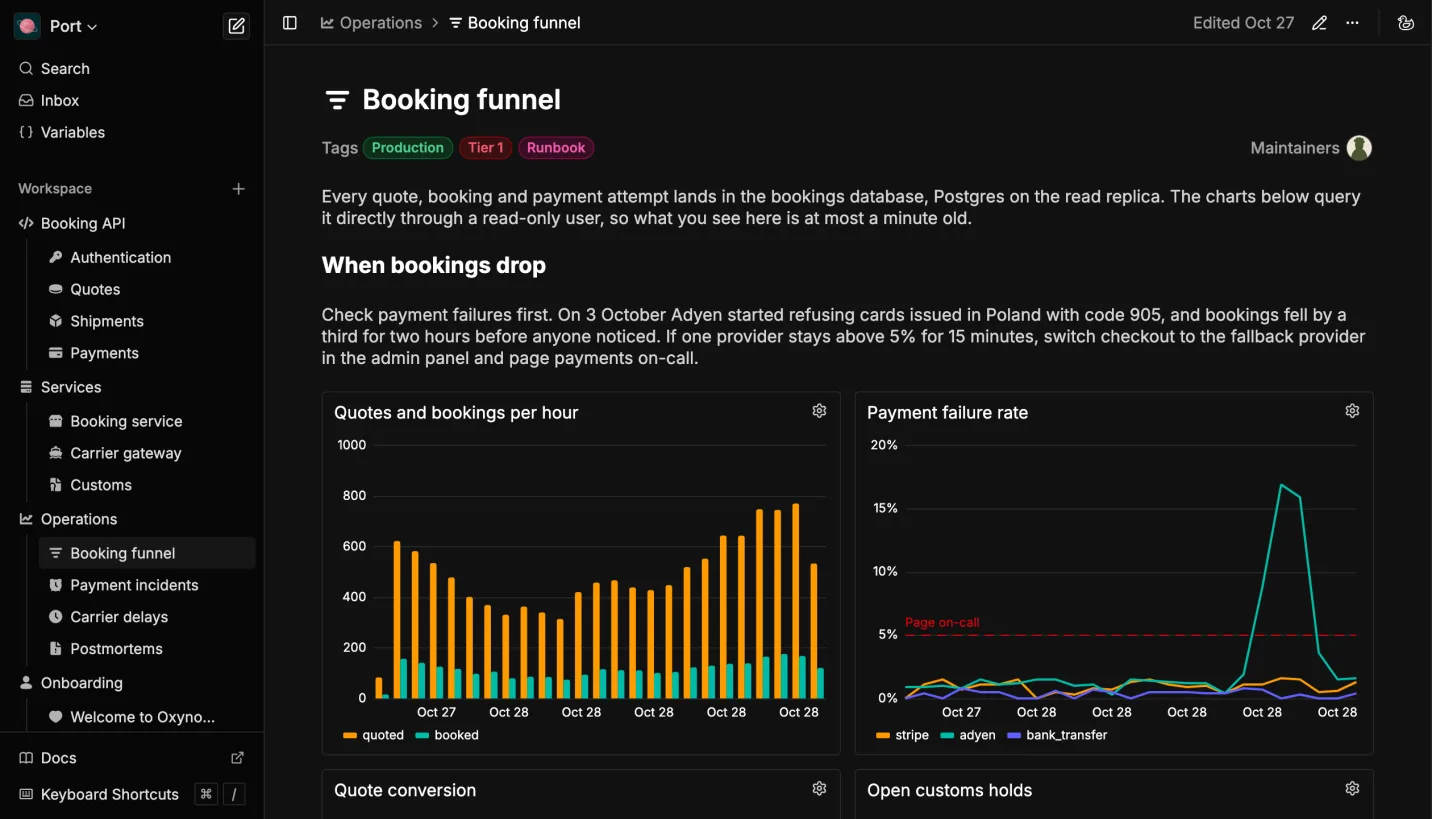 The runbook rule with the chart that checks it
Whoever is on call reads the rule and checks it in one place.
The chart beside it needs no exporter or extra instrumentation, as a Prometheus metric would. It counts rows the app writes anyway, and each numeric column becomes a series:
SELECT
  $__timeGroupAlias(created_at, '1h'),
  count(*) AS quoted,
  count(*) FILTER (WHERE status = 'booked') AS booked
FROM quotes
WHERE $__timeFilter(created_at)
GROUP BY 1
ORDER BY 1
A Page Support Can Read
Carriers report each container move to Port with a webhook, and some report faster than others. The carrier delays page charts the 95th percentile delay per carrier over the last week, using percentile_cont(0.95) WITHIN GROUP (ORDER BY delay_ms). An average would let a few very slow webhooks hide among the fast ones.
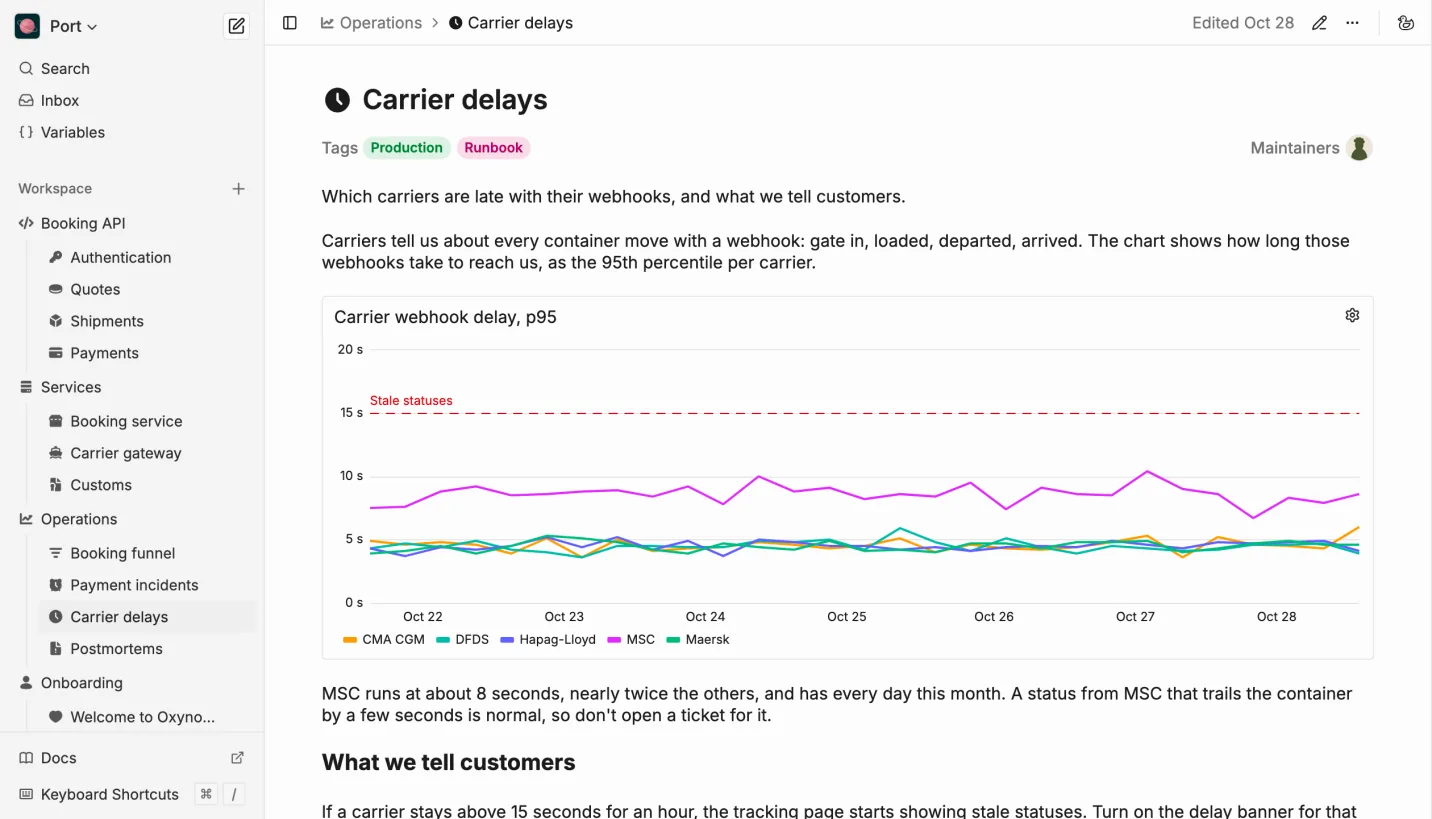
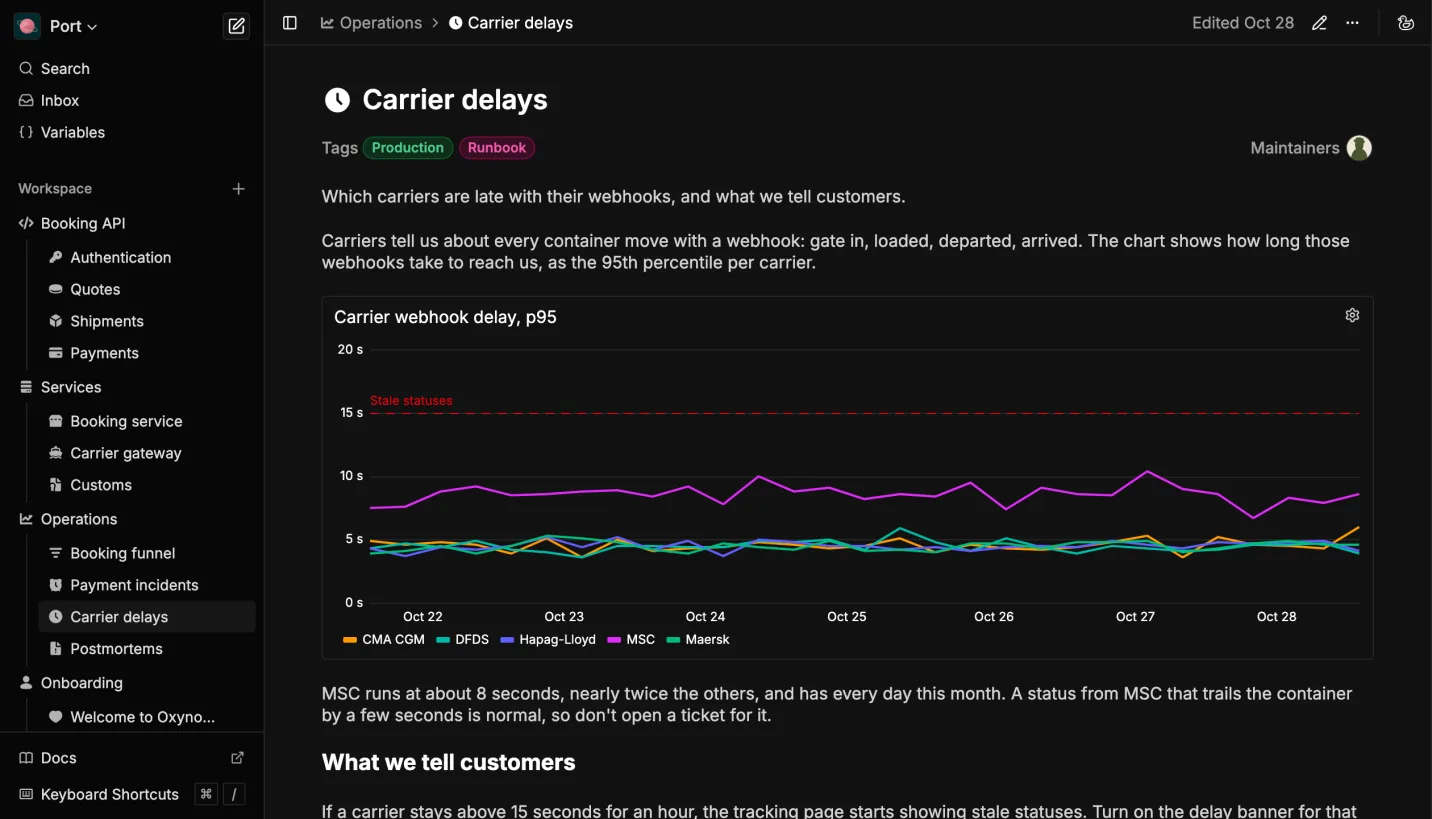 MSC sits at about 8 seconds, every day
MSC runs at about 8 seconds, nearly twice the others, and has all month. The page explains that this is normal and says what to do above 15 seconds, so support can answer "is this carrier late?" without asking an engineer.
Numbers That Are True Right Now
Some charts only need the current value. The number of open customs holds is a count of rows that haven't closed yet, so the query stamps it with the current time:
SELECT now() AS time, count(*) AS open_holds
FROM customs_holds
WHERE closed_at IS NULL
As a gauge, orange at 20 and red at 30, it tells the customs team whether the queue is normal before anyone opens the admin panel.
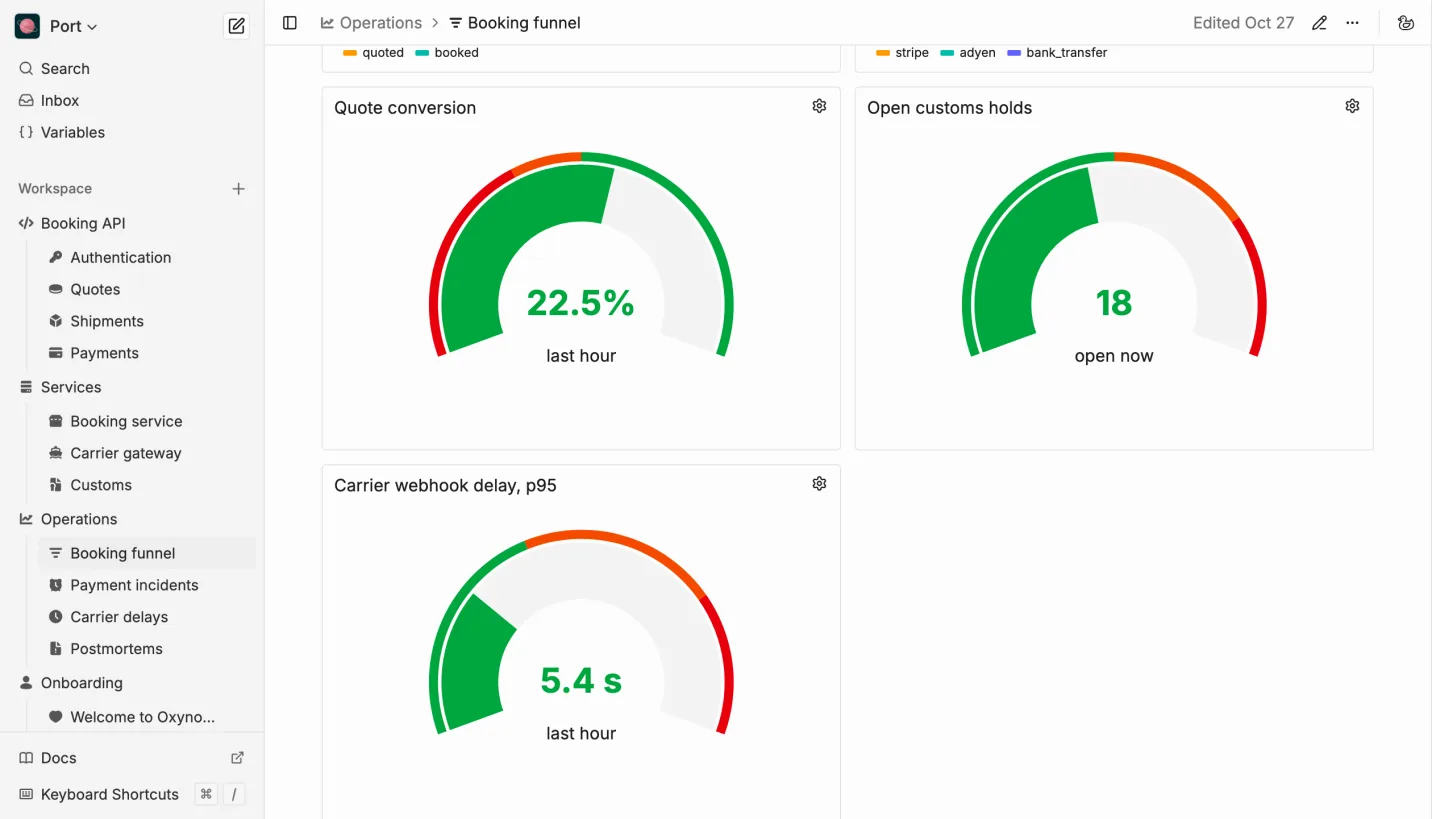
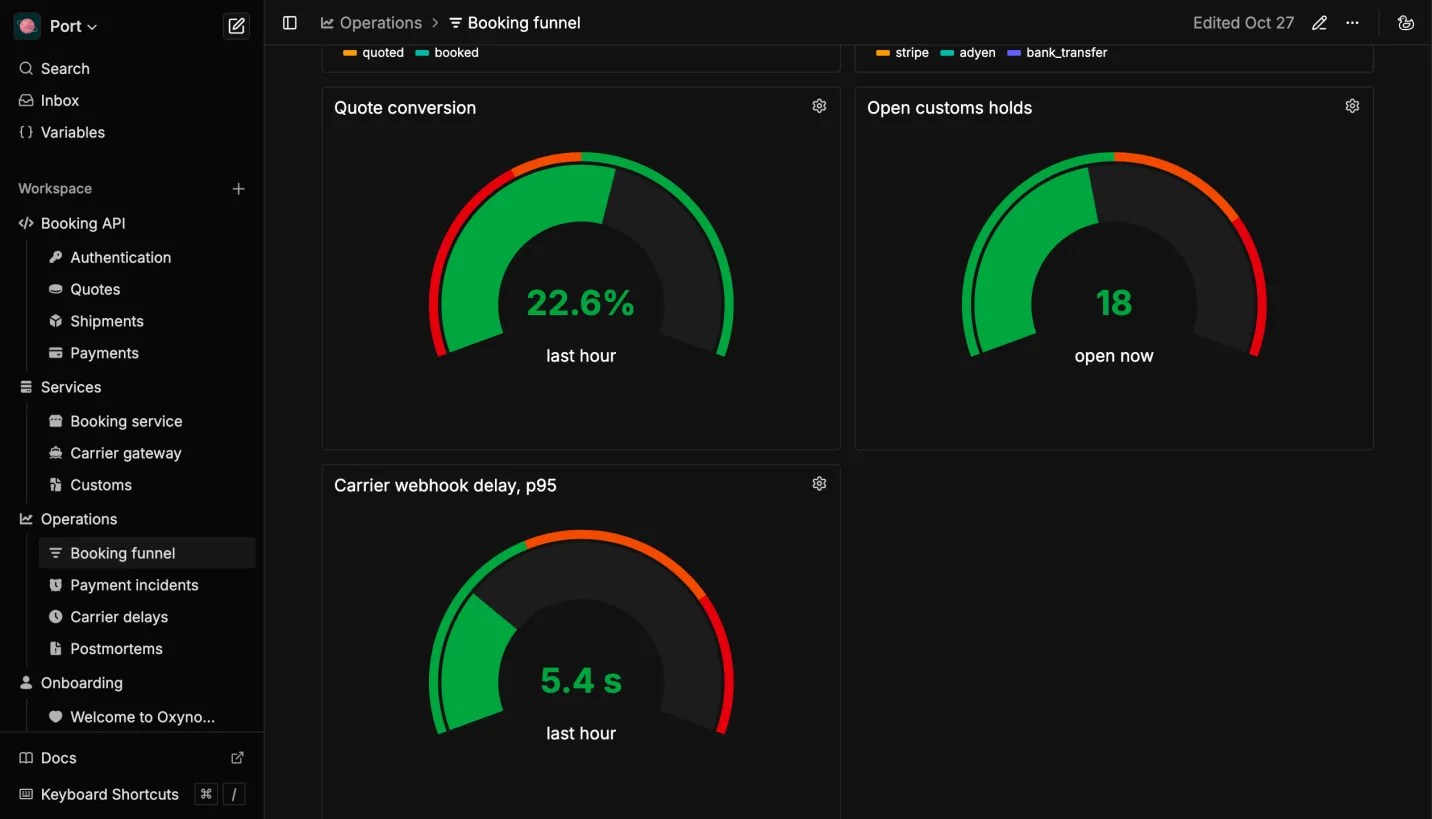 Current values as gauges
Wrapping Up
The grants are what keep your data safe, so review them the way you'd review a migration.
MySQL and MariaDB connect the same way, and their grants matter just as much.
Queries can also use variables: write WHERE carrier = '$carrier', and each reader picks the carrier in the Variables panel, so one chart covers every carrier.
Oxynote is open source and runs as one Docker container: github.com/oxynote/oxynote. If a step here doesn't match your setup, we'd like to hear about it: ask on Discord or open an issue.