Dovydas Bykovas7 min read
How to Securely Connect Prometheus to Oxynote for Live Charts
This guide puts a password on Prometheus, connects it to Oxynote as a data source and builds live charts from your metrics with PromQL.
Oxynote charts can query Prometheus directly with PromQL, so a page can show live graphs of your services next to the text that explains them. Out of the box, Prometheus has no login: anyone who can reach its port can read every metric. So put a password on it before you connect Oxynote.
This guide covers securing Prometheus, connecting it to Oxynote and three example pages built on it.
What You Need
- Oxynote, running. See the install guide.
- A Prometheus server that Oxynote's container can reach over the network.
- Access to the machine Prometheus runs on, to change its config and restart it.
The commands below run Prometheus 3.5 in Docker. On another setup, the files and flags stay the same.
Put a Password on Prometheus
Prometheus reads its users from a web config file, which it loads at startup when you pass --web.config.file. It stores bcrypt hashes, not the passwords themselves. The htpasswd tool from the Apache image makes one:
docker run --rm httpd:2.4-alpine htpasswd -nbB oxynote 'change-me'
# oxynote:$2y$05$pzFZA9UzqADCK3Yv5FBDYubdo/mZXdfwDojbvVTjVu1BLQVP0.13m
The output is the user name, a colon and the hash. Put the hash after the colon under basic_auth_users, in a file called web.yml:
basic_auth_users:
  oxynote: $2y$05$pzFZA9UzqADCK3Yv5FBDYubdo/mZXdfwDojbvVTjVu1BLQVP0.13m
Then start Prometheus with the file, from the folder that holds it and your prometheus.yml:
docker run -d --name prometheus -p 9090:9090 \
  -v "$PWD/prometheus.yml:/etc/prometheus/prometheus.yml:ro" \
  -v "$PWD/web.yml:/etc/prometheus/web.yml:ro" \
  -v prometheus-data:/prometheus \
  prom/prometheus:v3.5.0 \
  --config.file=/etc/prometheus/prometheus.yml \
  --storage.tsdb.path=/prometheus \
  --web.config.file=/etc/prometheus/web.yml
-v "$PWD/…:ro"mounts each file into the container, read-only.-v prometheus-data:/prometheuskeeps the metrics in a Docker volume, so they survive a restart.- The last three lines replace the image's default arguments, so the first two repeat them and the third adds the web config.
Check that it worked. Without the password, Prometheus now answers 401. With it, you get its version:
curl -s -o /dev/null -w '%{http_code}\n' \
  localhost:9090/api/v1/status/buildinfo
# 401

curl -s -u oxynote:change-me localhost:9090/api/v1/status/buildinfo
# {"status":"success","data":{"version":"3.5.0",...}}
Encrypt the Connection
The password travels with every request. Over plain HTTP, anyone on the network between Oxynote and Prometheus can read it. When they run on different machines, give Prometheus a certificate in the same file:
tls_server_config:
  cert_file: /etc/prometheus/prometheus.crt
  key_file: /etc/prometheus/prometheus.key
basic_auth_users:
  oxynote: $2y$05$pzFZA9UzqADCK3Yv5FBDYubdo/mZXdfwDojbvVTjVu1BLQVP0.13m
Mount both files into the container next to web.yml. Prometheus then only accepts https:// and answers plain HTTP with 400.
To get the certificate, Prometheus's TLS guide makes a self-signed one with openssl. For a hostname on the internet, Let's Encrypt issues one for free. If a reverse proxy already handles TLS for your other services, it can do it here too.
Connect It in Oxynote
Open Settings, go to External Data Sources and click Connect next to Prometheus. Then fill in the form:
- Data Source Nickname: the name pages show, such as
Lumen Pay Prometheus. - Data Source URL:
https://<host>:9090, orhttp://if you skipped TLS. - Auth Username and Auth Password:
oxynoteand its password. - CA Certificate, optional: when Prometheus's certificate is signed by your own CA, paste that CA here. Oxynote then trusts only it.
The host is where Oxynote's container finds Prometheus, and localhost there means the container itself, not your machine:
- If Prometheus runs in Docker on the same network as Oxynote, such as in the same Compose file, use its service name, such as
prometheus. - If it runs on the same machine as Oxynote but on a port published to that machine, use
host.docker.internal. Docker Desktop on Mac and Windows provides that name. On Linux, add--add-host=host.docker.internal:host-gatewayto Oxynote'sdocker run. - Anywhere else, use its hostname.
Test & Save asks Prometheus for its version with the credentials you entered. A wrong password shows "Authentication credentials are incorrect":
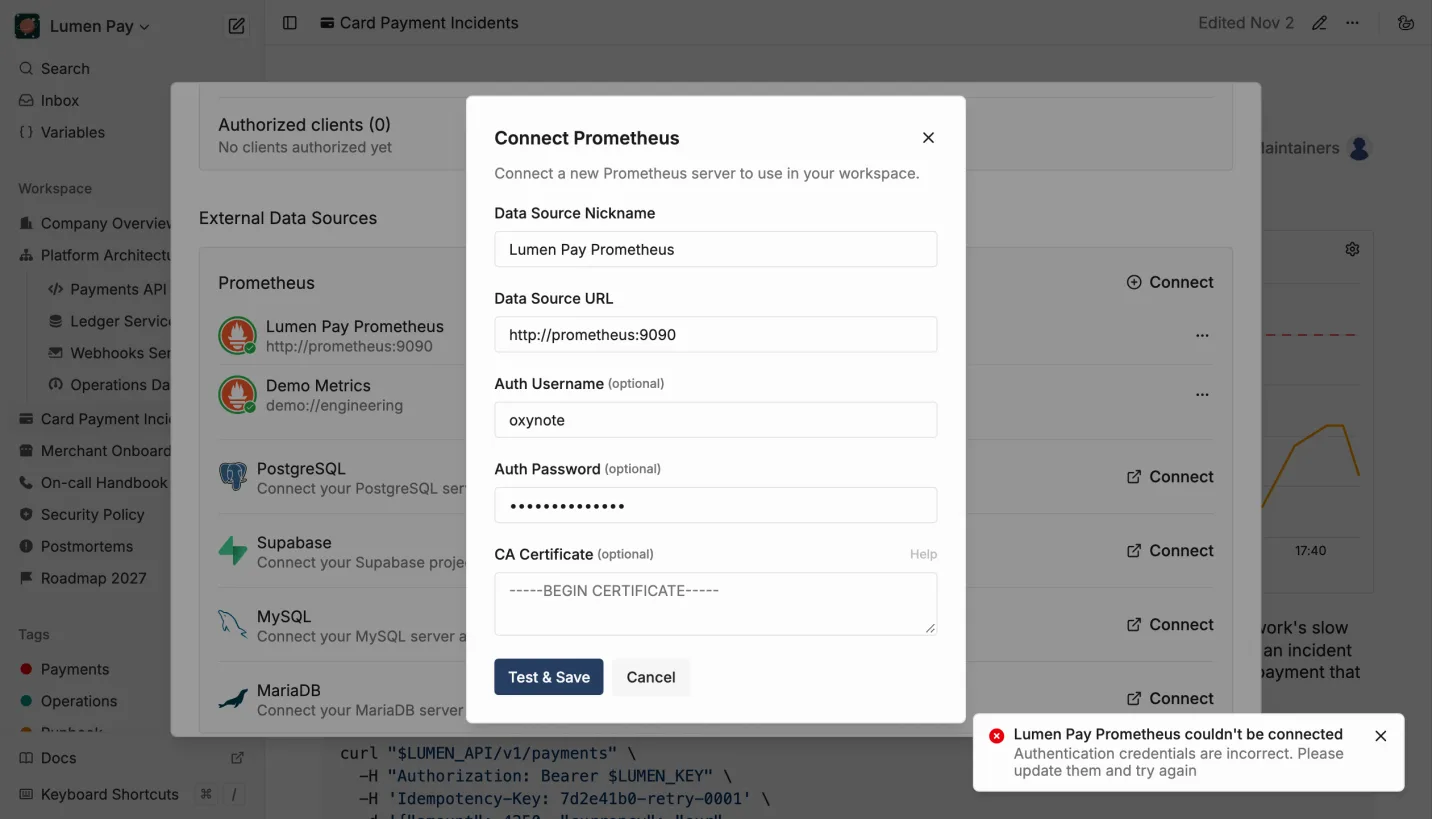
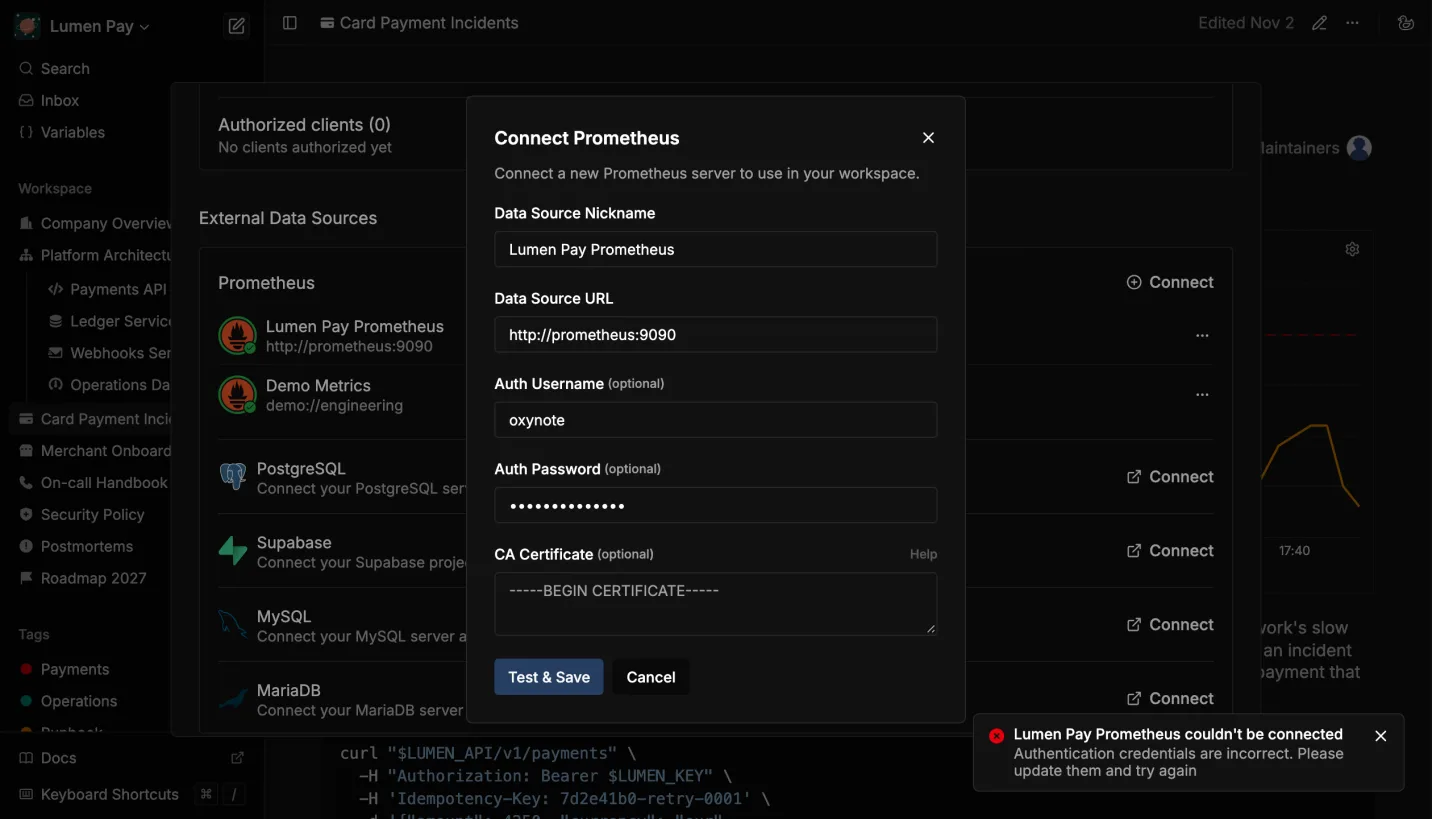 The wrong password, caught before saving
With the right one, the data source joins the list with a green tick:
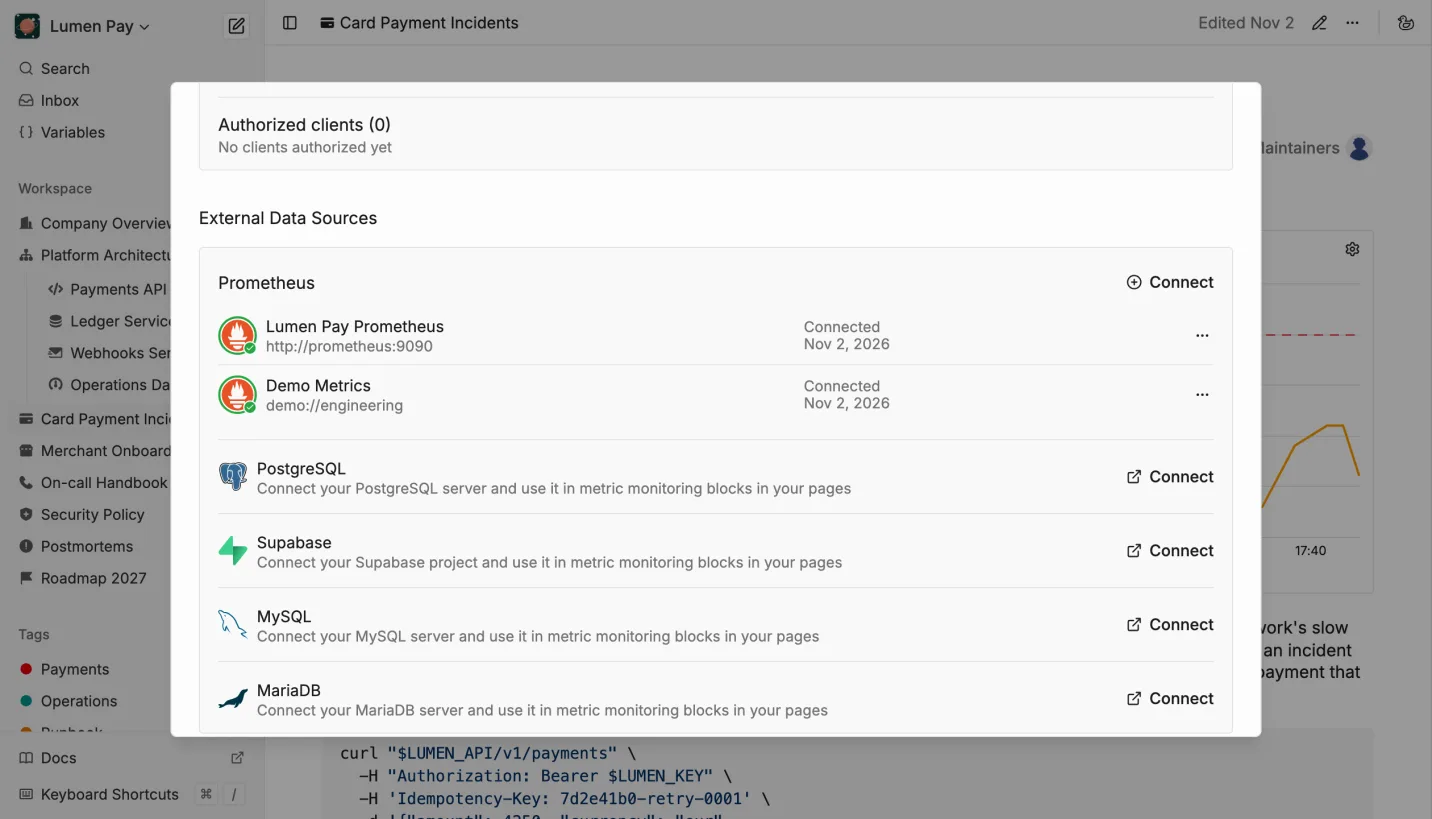
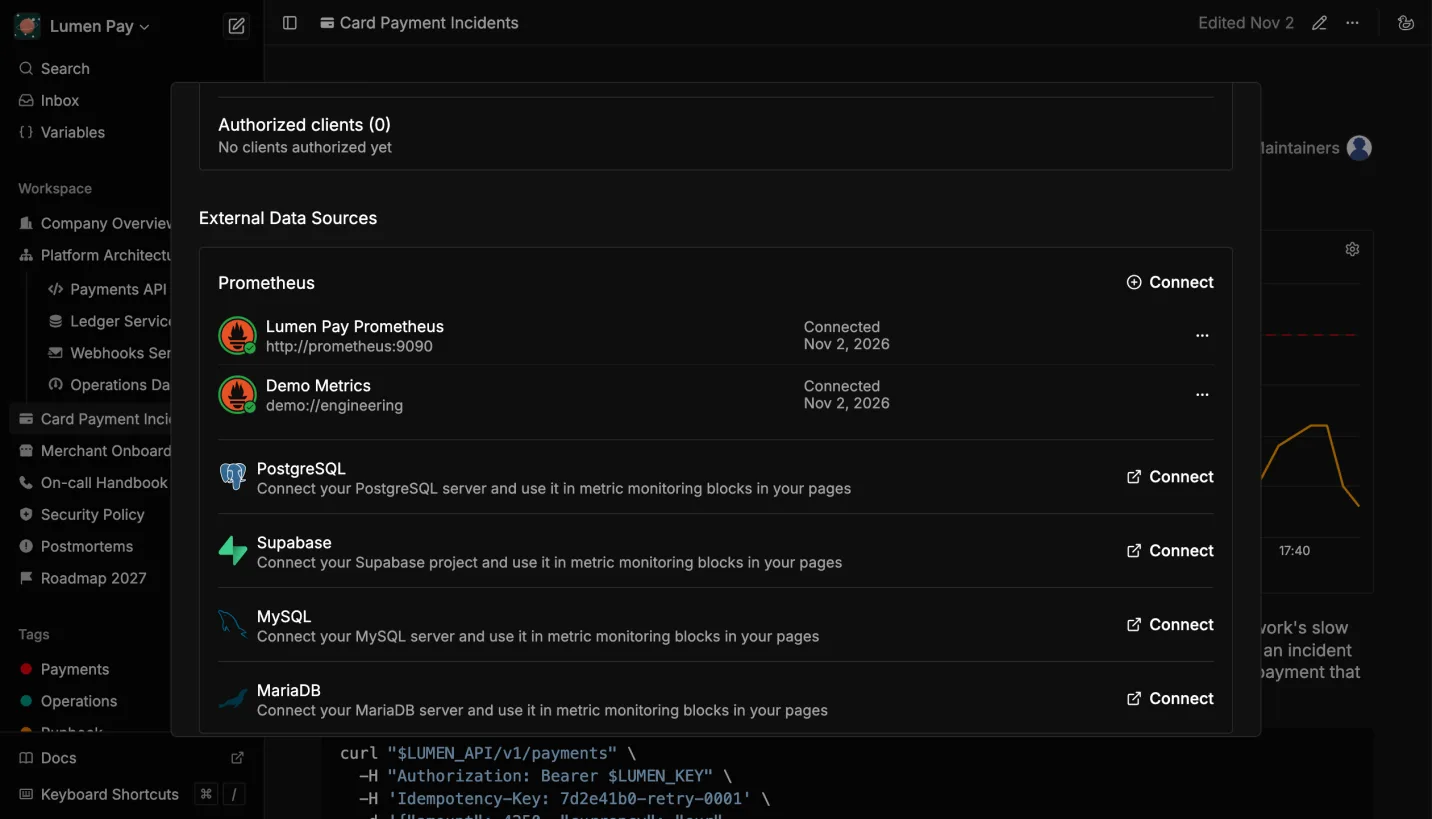 Lumen Pay Prometheus, connected with its password
Oxynote signs in with a user name and password only. A Prometheus-compatible service that needs a bearer token or AWS signatures can't connect this way.
Oxynote only reads from Prometheus. If a firewall or reverse proxy in front of it lets through only some paths, these are the ones Oxynote calls:
/api/v1/status/buildinfo, for Test & Save./api/v1/query_range, for every chart./api/v1/metadata,/api/v1/labels,/api/v1/label/<name>/valuesand/api/v1/series, for completions in the query editor.
Draw the First Chart
On any page, type / and choose Live Metrics. Pick the data source and write a PromQL query. The editor completes metric names, labels and label values from your server as you type.
This one charts declined payments next to timed-out ones:
sum by (status) (
  rate(
    http_requests_total{route="/v1/payments", status=~"402|502"}[$__rate_interval]
  )
)
rate() turns the request counter into requests per second, and sum by (status) adds up every series with the same status into one line. Setting the Legend field to {{status}} names each line after it.
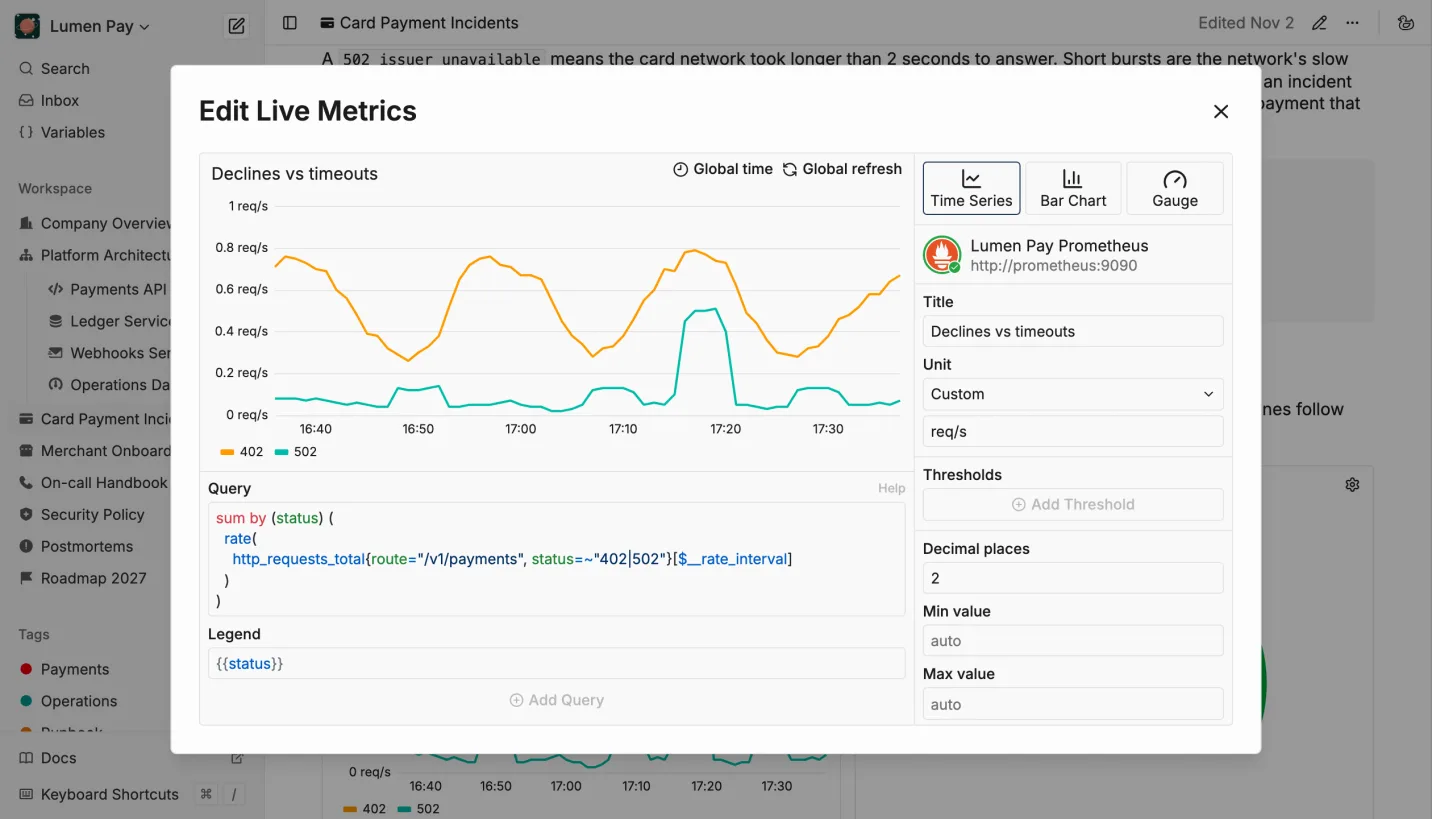
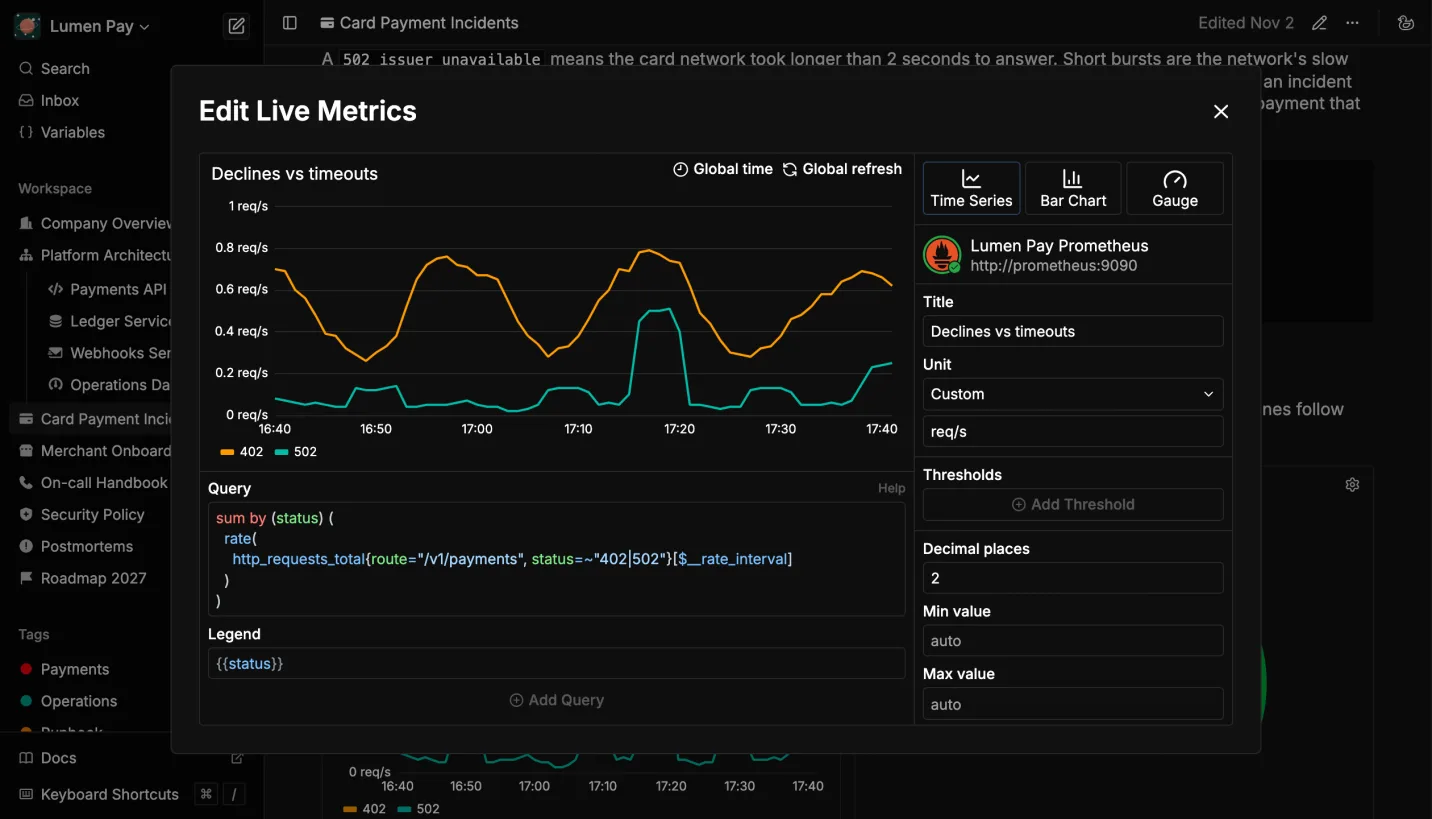 Declines and timeouts, one line each
Oxynote picks how far apart a chart's points are from its time range, and three macros follow that choice:
$__intervalis the time between two points.$__rate_intervalis a window wide enough forrate()andincrease()at that spacing. Use it inside them.$__rangeis the chart's whole time range, such as86400sfor a day.
A fixed [5m] in rate() works for a short range. On a long one, though, the points sit further apart than 5 minutes, so rate() skips the samples between them and a short spike can disappear. $__rate_interval grows with the range, so every sample counts. If you've used Grafana, these follow its names.
A query returns at most 1,000 series. When a metric has more, aggregate it with sum by (…) to the labels you want to see.
Three Pages Worth Building
The screenshots come from a demo workspace for Lumen Pay, a made-up card payments API. It holds what a payments team keeps written down: the architecture, the API reference, runbooks and postmortems. Its Prometheus scrapes three Go services under simulated traffic, with a fake card network that's slow every 10 to 25 minutes.
A Runbook With Its Evidence
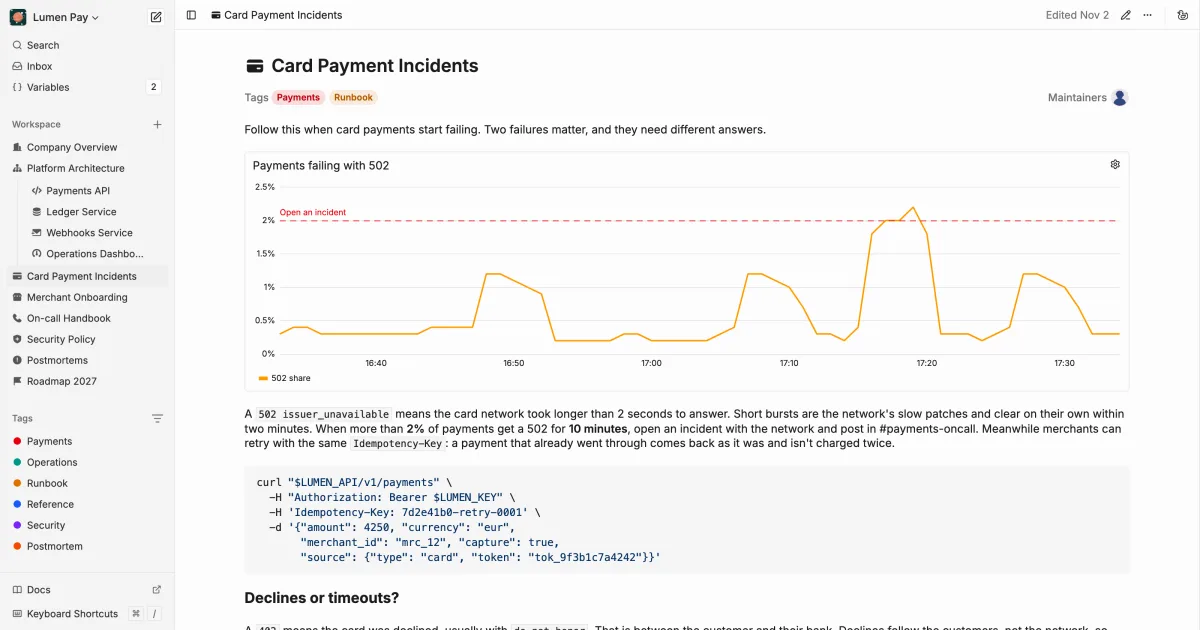
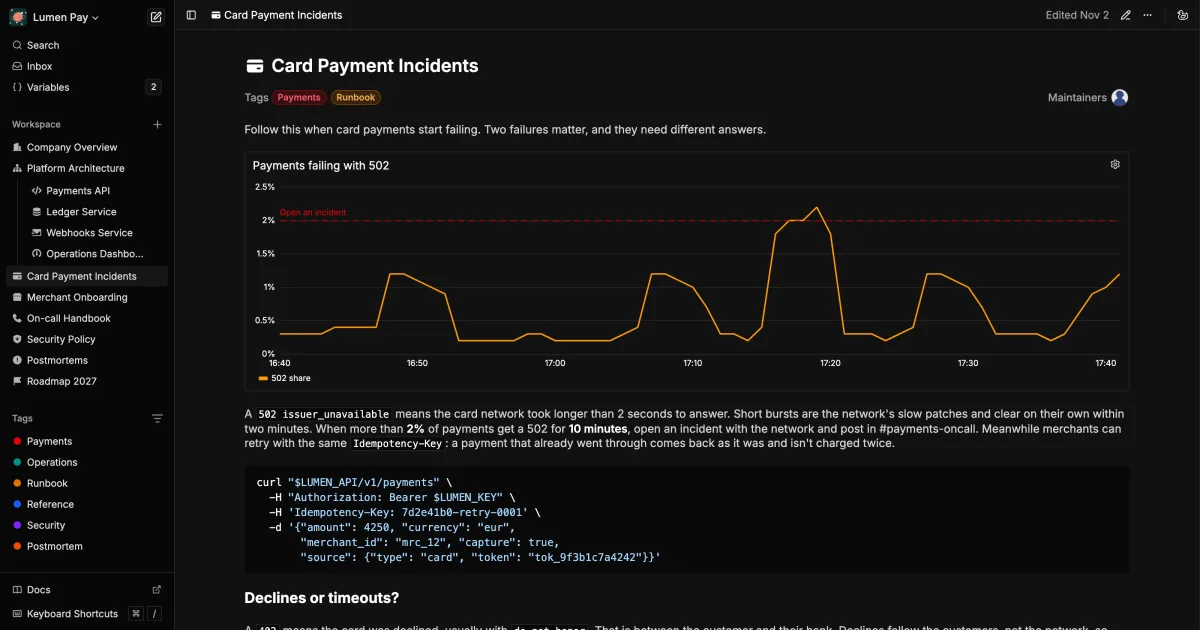
Lumen Pay's Card Payment Incidents page opens with the share of payments that got a 502 issuer_unavailable, which means the card network took longer than 2 seconds to answer. The 2% line is drawn in:
sum(rate(
  http_requests_total{route="/v1/payments", status="502"}[$__rate_interval]
))
/
sum(rate(
  http_requests_total{route="/v1/payments"}[$__rate_interval]
))
* 100
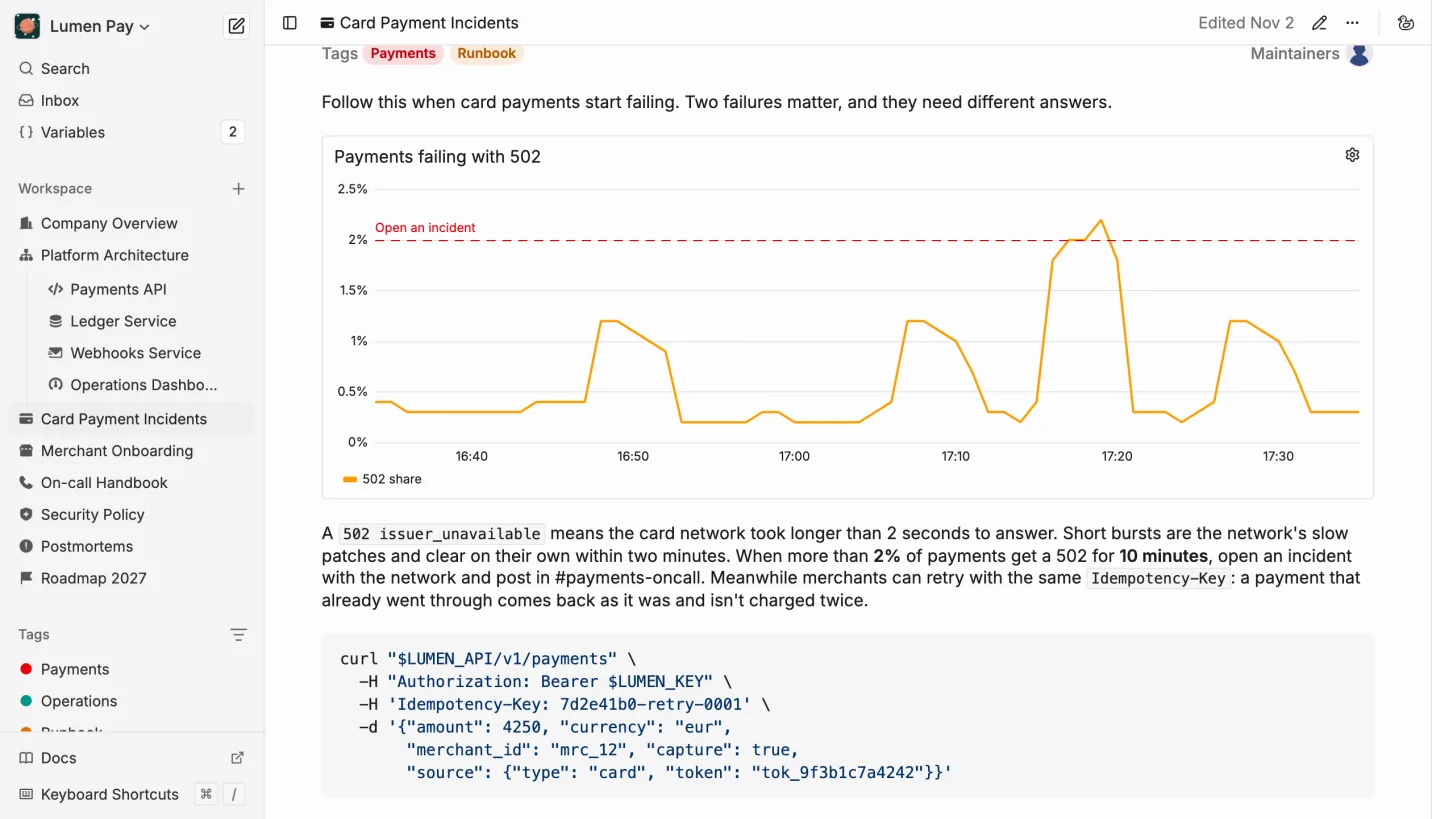
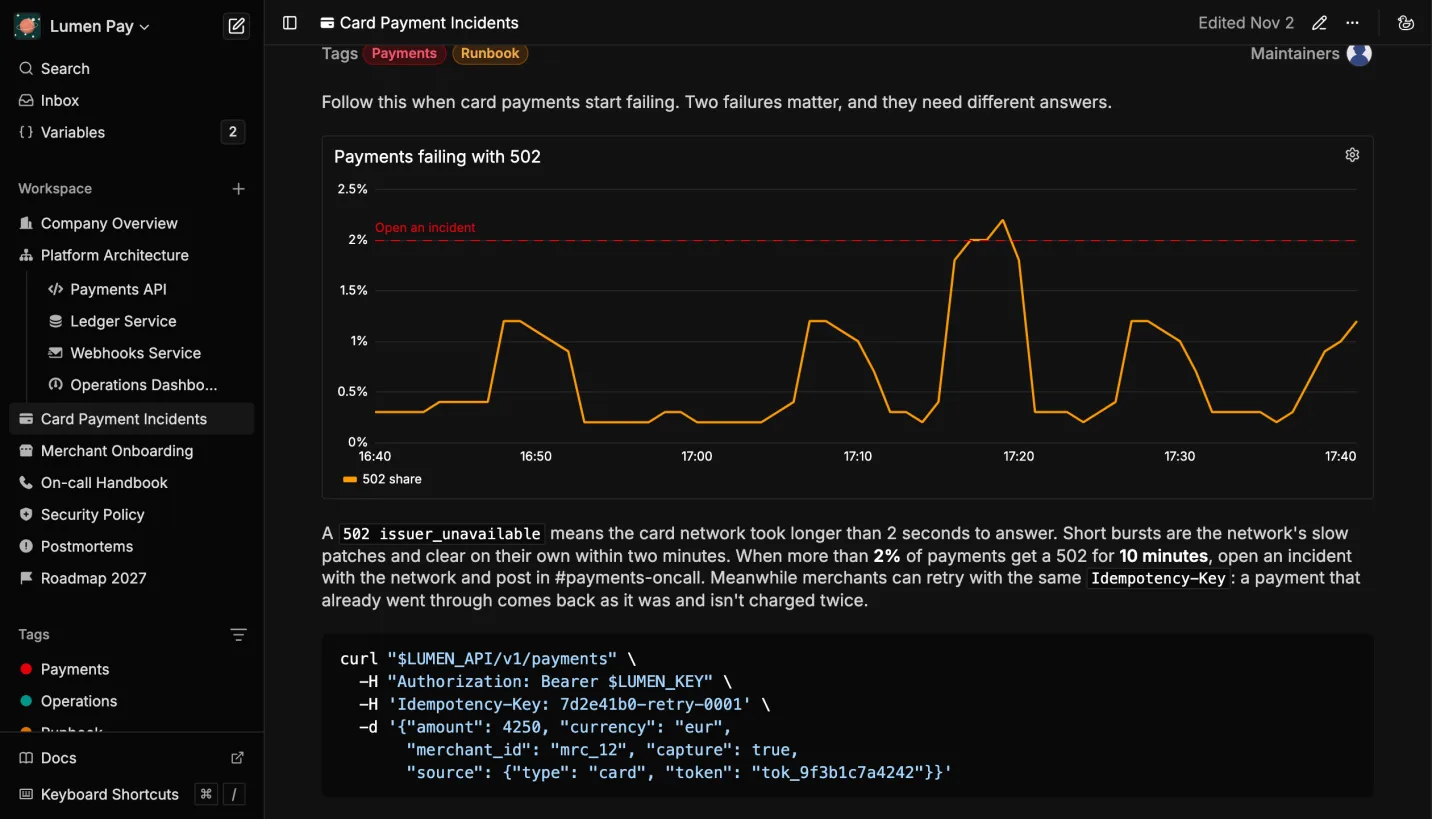 The chart, the rule under it and the command to run
Under the chart, the page says what the line means. Short bursts are the network's slow patches and clear on their own. More than 2% for 10 minutes means opening an incident with the network. Meanwhile, merchants can retry with the same Idempotency-Key, and the page has the curl for it. Further down, declines and timeouts sit side by side, because a 402 is between the customer and their bank and needs no one on call.
Whoever is on call reads the rule and checks it in one place, without opening Grafana and finding the right panel.
Latency That Shows the Slow Requests
The Payments API page documents each endpoint, with the request on the right. Under them, a Response times section charts how fast the API answers. The API records how long each request takes in a histogram, http_request_duration_seconds, and histogram_quantile turns its buckets into the 95th percentile per route:
histogram_quantile(0.95, sum by (le, route) (
  rate(http_request_duration_seconds_bucket[$__rate_interval])
))
le is the label that holds each bucket's upper bound, so it must stay in sum by. Leave it out, and the query returns nothing.
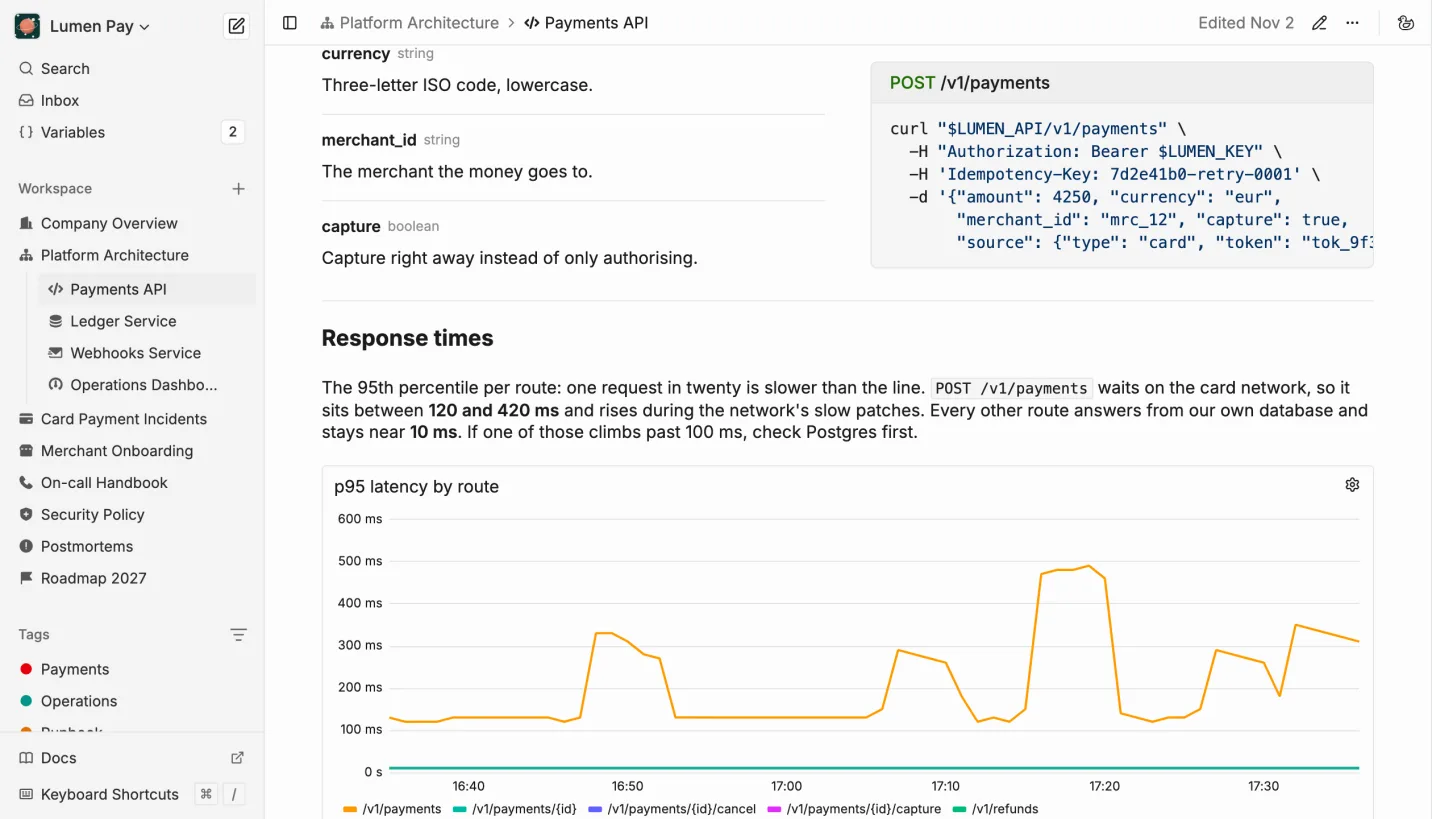
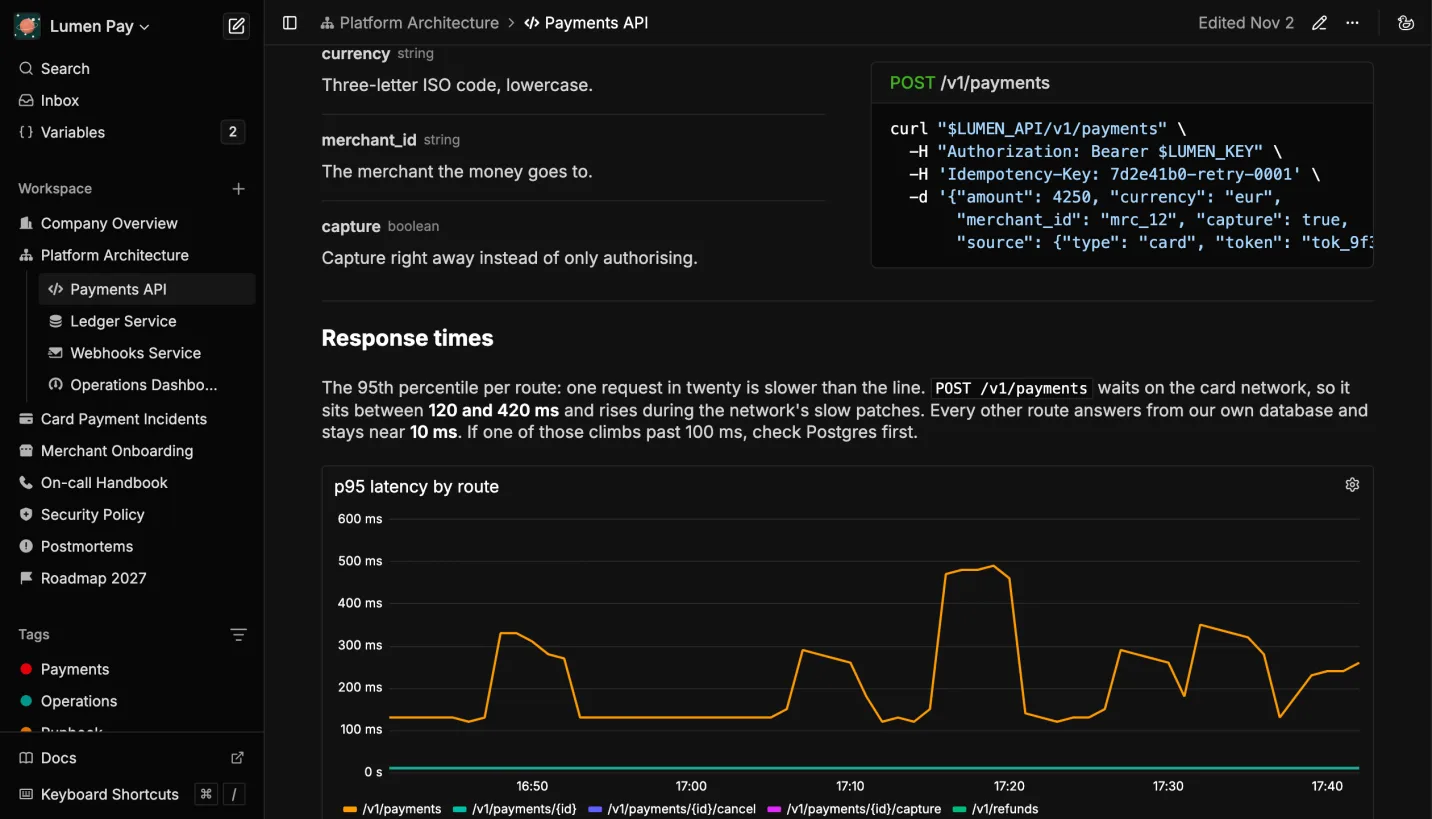 Card payments wait on the card network, everything else stays fast
POST /v1/payments waits on the card network and sits between 120 and 420 milliseconds. Every other route stays near 10. An average would hide the slow patches among the fast requests. The 95th percentile shows them.
Numbers That Are True Right Now
The Operations Dashboard opens with two gauges. A gauge shows only the latest value of its query. The payment approval rate is the share of payments that end in 201, as a percentage:
sum(rate(
  http_requests_total{route="/v1/payments", status="201"}[$__rate_interval]
))
/
sum(rate(
  http_requests_total{route="/v1/payments"}[$__rate_interval]
))
* 100
The fake card network declines 3% of cards, so a healthy stack sits near 97%. The gauge turns red below 95%. Next to it, the webhooks backlog counts the events the webhooks service still has to deliver:
sum(
  jetstream_consumer_num_pending{consumer_name="webhooks"}
  + jetstream_consumer_num_ack_pending{consumer_name="webhooks"}
)
The outer sum() keeps it one number. Without it, a restart of the message queue gives its series new labels, and the gauge shows one dial for each set it saw in the time range.
The backlog climbs into the hundreds when a merchant's endpoint slows down and should drain within minutes. The page says so, so nobody pages anyone over it. Under the gauges, a chart of requests by status follows the route picked in the Variables panel, through {route="$route"} in its query.
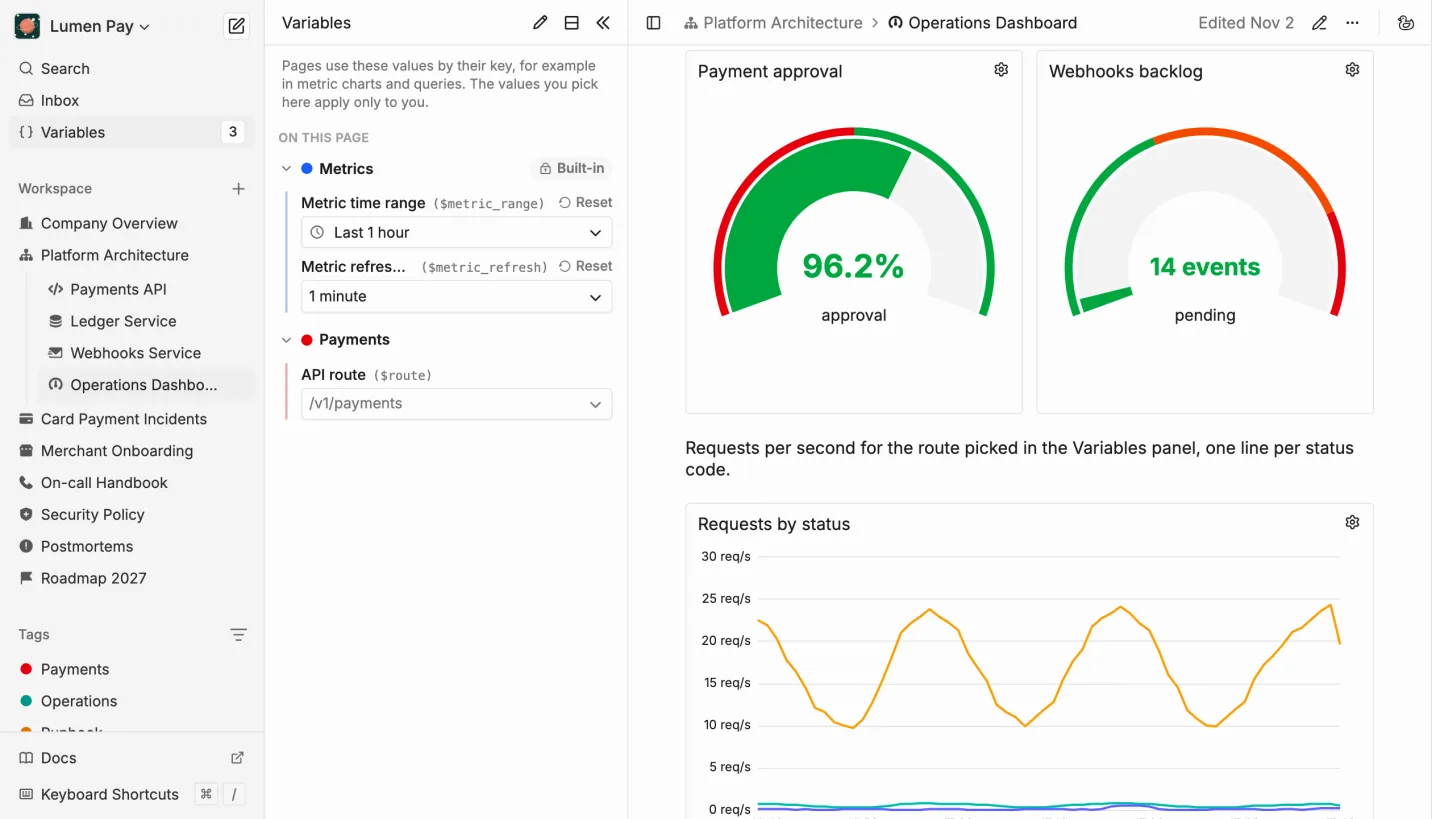
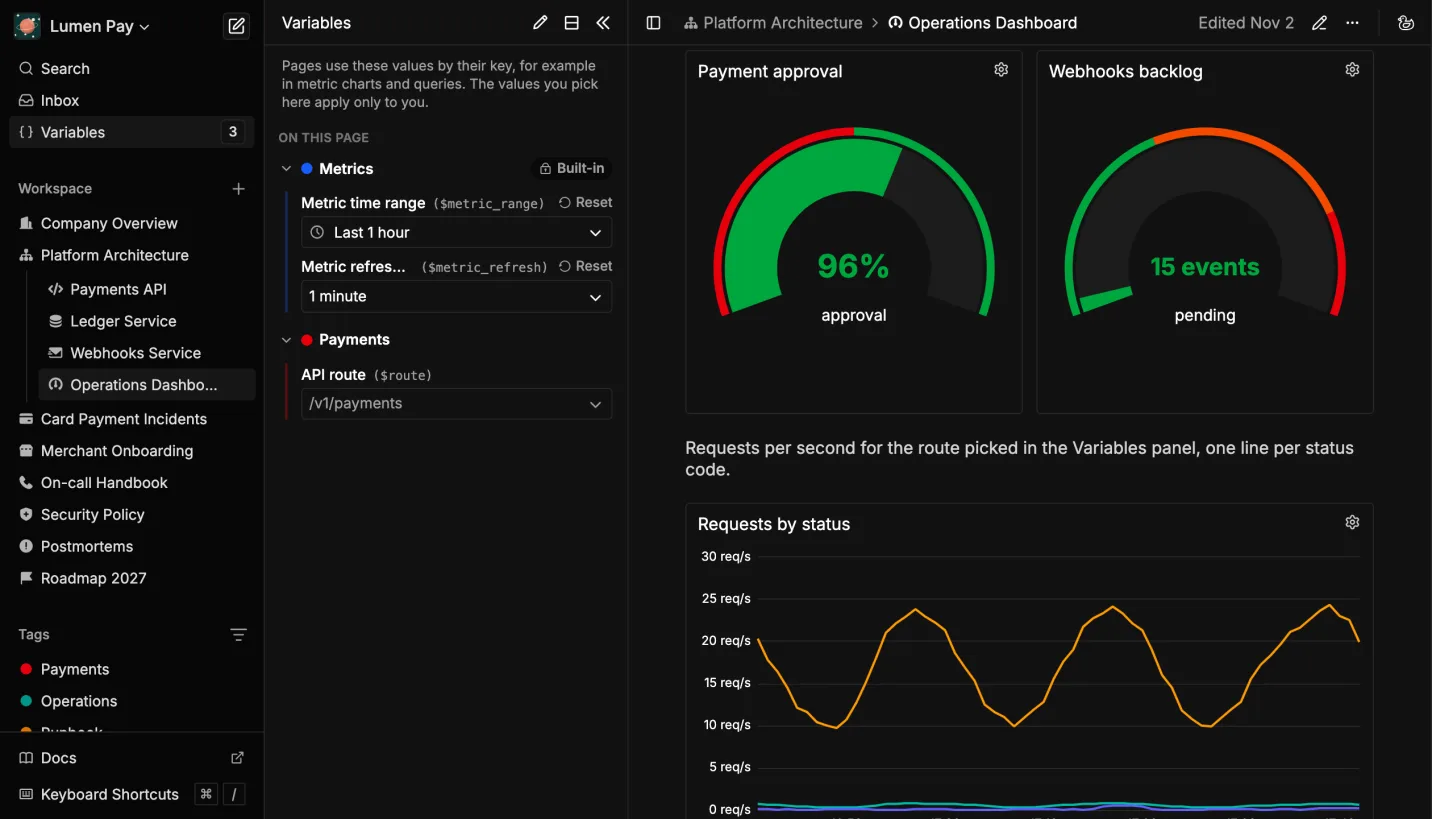 Current values as gauges, with the route variable beside them
Wrapping Up
The password keeps strangers away from your metrics, and TLS keeps the password itself off the network. A good first page is the runbook your team opens most, with a live chart of the metric it's about.
Oxynote is open source and runs as one Docker container: github.com/oxynote/oxynote. If a step here doesn't match your setup, we'd like to hear about it: ask on Discord or open an issue.