Dovydas Bykovas8 min read
How to Write a Runbook With Live Charts and Logs
This guide covers what a good runbook answers, gives you a template to copy, and builds one in Oxynote, with the chart or logs each step needs next to it.
A runbook is the page an engineer follows when something breaks, often after being woken up by an alert. Most of its steps ask a question, such as "is the queue backing up?", and the answer usually sits in another tool. So the engineer has to open Grafana, find the right chart, set the time range, and come back to the runbook. It would work better if each step had the data right beside it.
This guide covers what a good runbook answers, a template you can copy, and a runbook built in Oxynote, with a chart or logs next to each step.
Why Runbooks Get Skipped
Runbooks are worth writing. Google's SRE book calls them playbooks, and the team behind it found that writing the steps down ahead of time fixes incidents roughly three times faster than "winging it". Yet many runbooks go unread, mainly for three reasons.
The first is that the runbook points somewhere else. A step says "check the dashboard" or holds a command to paste into a terminal. So in the middle of an incident, the reader is forced to switch between tools to follow it, which easily gets confusing and takes more time than it should.
The second follows from the first. When the runbook doesn't answer the question quickly, people stop opening it. They search Slack or call someone senior instead.
The third is that the runbook goes out of date. Google's SRE Workbook says that "details in playbooks go out of date at the same rate as production environment changes". A step that still names an old service or a deleted chart sends the reader the wrong way. And this is worst for the runbooks you rarely open. Jos Visser, who worked as a site reliability engineer on Google's Maps, Orkut, and YouTube teams, puts it this way:
The less frequently the runbook is executed, the more likely it is to be incorrect.
What a Good Runbook Answers
The on-call engineer should find the answers to these five questions in the runbook itself:
- When to use it: the alert or symptom that leads to this page, such as an alert that the queue has been backing up for 10 minutes.
- Who owns it: the team that keeps the page correct, and who to call when the steps don't help.
- What to look at: the exact chart or log query for each check.
- When to act: the value that turns a check into an action, such as a latency above 200 ms for 5 minutes.
- What to do: the command or other actionable steps, and how to tell they worked.
Of the five, what to look at and when to act are the ones most runbooks skip. A step that only says "check the dashboard" leaves the reader to find the right chart, pick a time range, and decide what counts as bad, all in the middle of an incident.
A Runbook Template to Copy
The template below works in any tool that stores text, such as Confluence, Notion, or a Markdown file in your repository. Each step names the question, the chart and query that answer it, and the value that means "act":
# <Symptom> Runbook

Follow this when <the alert or symptom>.
Owner: <team>. If the steps below don't help within <time>, call <who>.

## 1. <The question this step answers>

Look at: <chart>, last <time range>.

```
<the query behind the chart>
```

Act when: <threshold>, such as p99 above 200 ms for 5 minutes.
Then run:

```bash
<the command>
```

It worked when: <what the chart or logs show afterwards>.
If not: go to step 2.

## 2. <The next question>

## After the Incident

- Post what you saw and what you ran in <incident channel>.
- If a step was wrong or missing, fix this page.
In most tools, "Look at" ends up as a link to a chart in Grafana, and the query is a copy that can drift away from that chart.
Build It in Oxynote
Oxynote is a wiki whose pages hold live charts and logs from your own data sources. So in Oxynote, the link in "Look at" can be replaced with the charts and logs themselves, right under the step.
The following screenshots come from a demo workspace for Lastport, a made-up shipping company that moves containers between mid-sized ports. Its ships report their position over satellite every 30 seconds, and a service called tracking-ingest receives them. This stream of positions is the position feed. Lastport's Delayed Shipment Runbook starts like the template:
Follow this when a voyage is expected to arrive more than 6 hours late. Owner: Fleet Operations. If the steps below don't help within 30 minutes, call the Fleet Operations lead.
Put the Chart in the Step
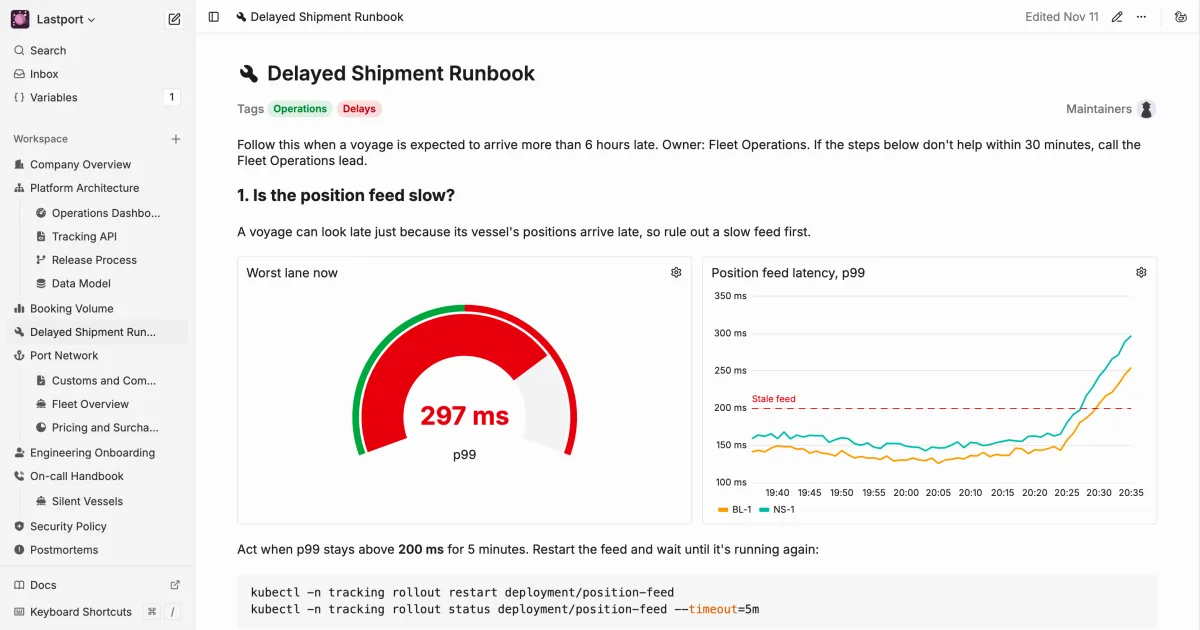
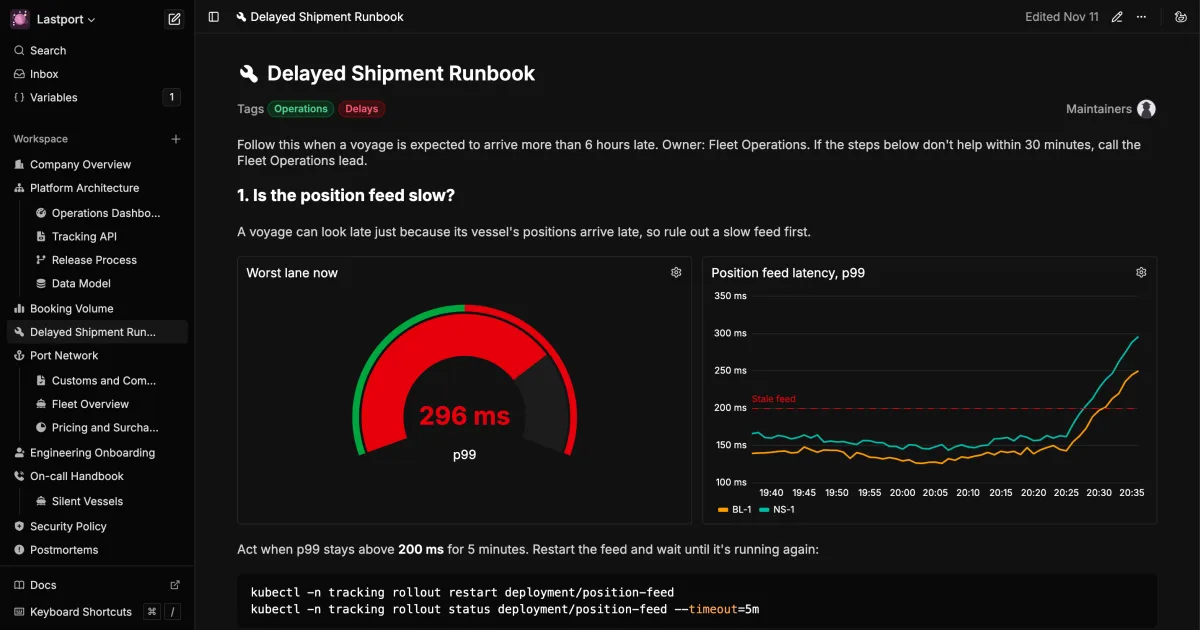
A voyage can look late just because its ship's positions arrive late. So the first step rules out a slow feed. Under it, a Live Metrics block shows how long positions take to arrive on each lane, from Lastport's PostgreSQL. It charts the 99th percentile, or p99: 99 out of 100 positions arrive faster than this line.
SELECT $__timeGroupAlias(ts, '1m'), lane, max(p99_ms) AS p99
FROM position_latency
WHERE $__timeFilter(ts)
GROUP BY 1, lane
ORDER BY 1, lane
The step's "Act when" goes on the chart as a threshold. The chart then draws a line at 200 ms, so the reader sees whether the feed crossed it without reading values off the axis. To add one to your own chart, click its gear icon, and under Thresholds, click Add Threshold. Enter the value from your "Act when", give it a label you'll recognize at a glance, such as Stale feed, and pick a color.
Next to the chart, a gauge shows only the newest value from the slowest lane and turns red above the same 200 ms. So the reader gets the answer to the step's question before reading the chart. The gauge is a second Live Metrics block with Gauge as its type, dragged onto the chart's side.
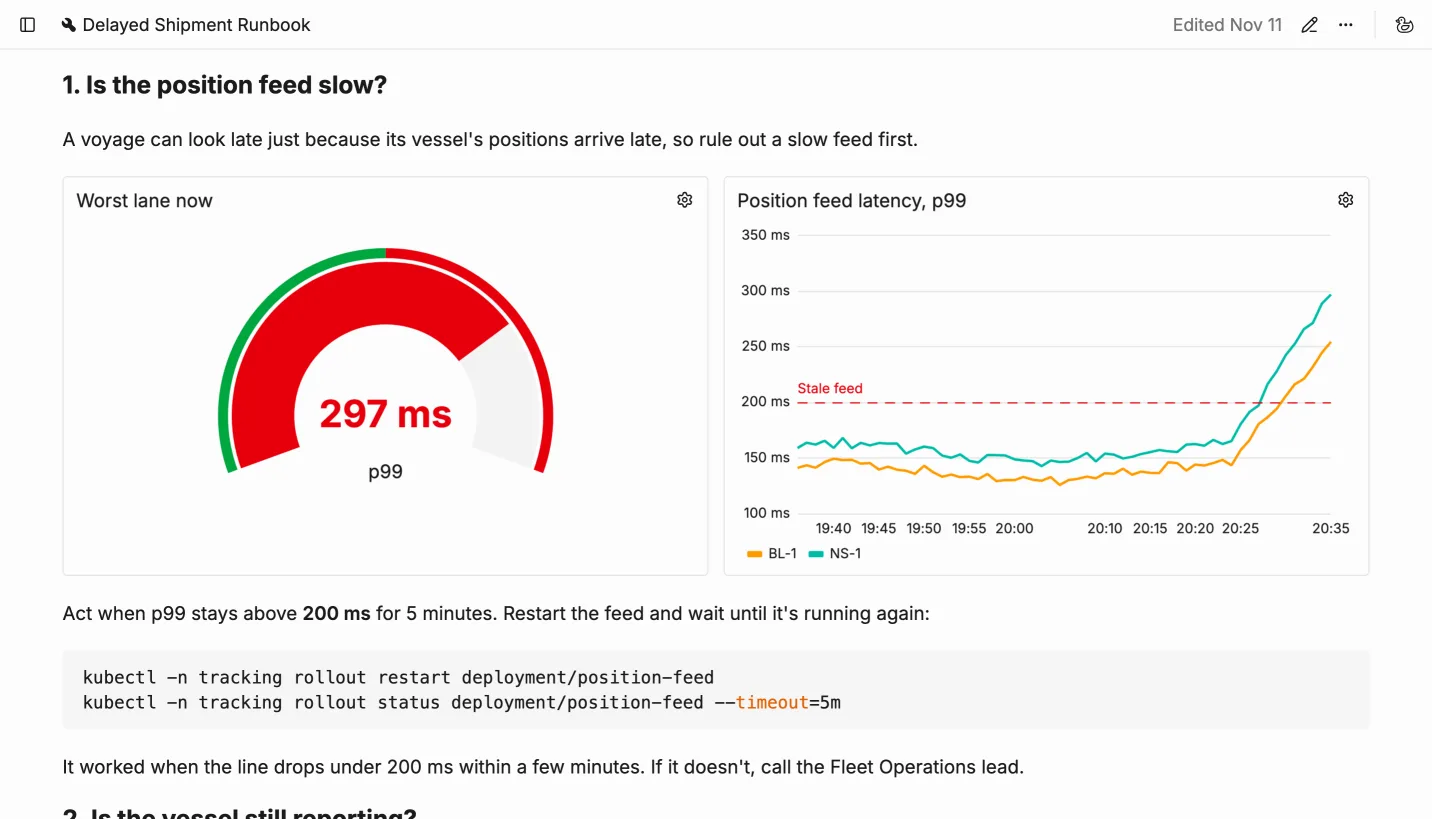
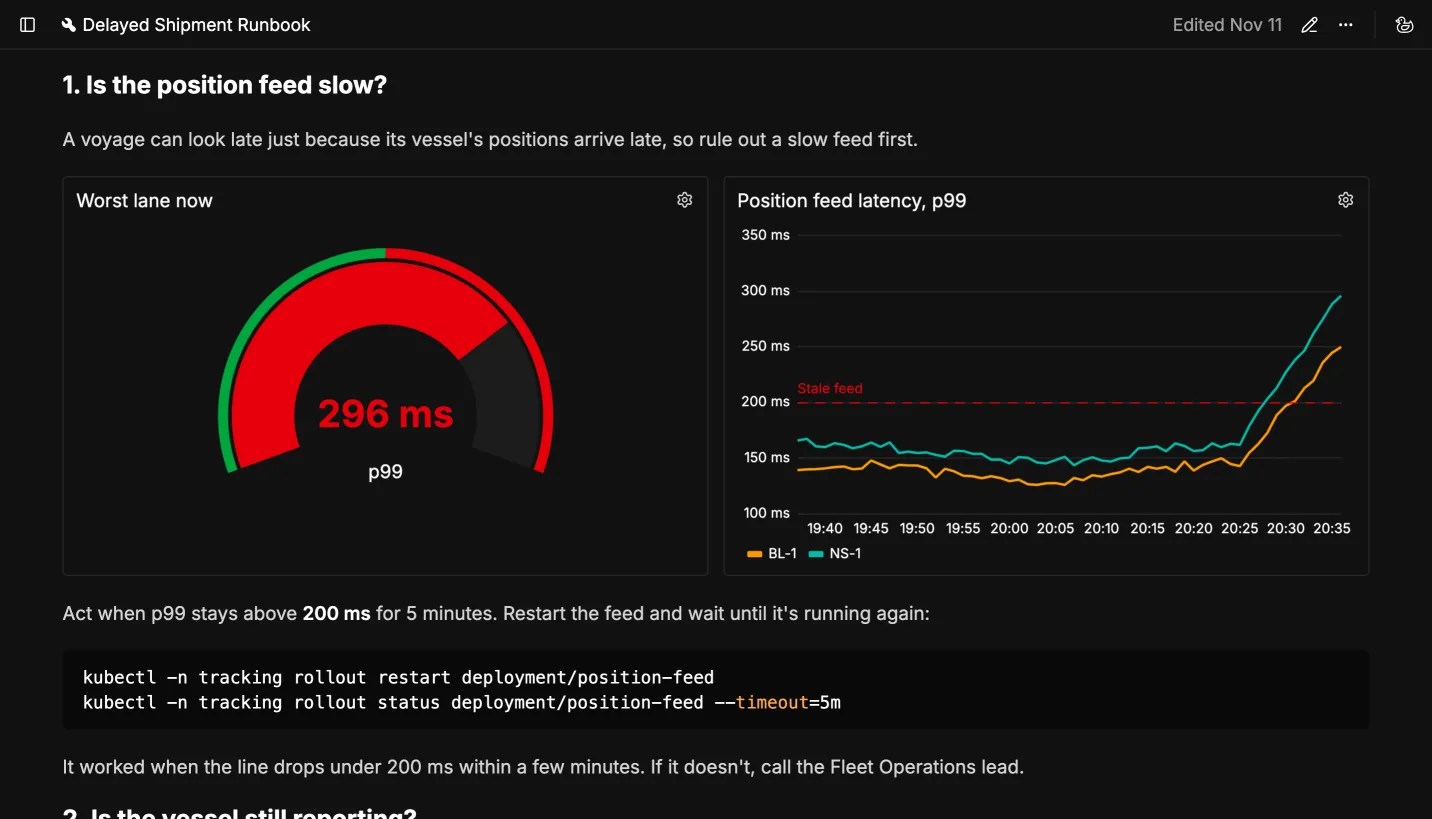 The first step, with the gauge and the chart that answer it
Under the chart, the step says what to do when p99 stays above the line for 5 minutes. These commands restart position-feed, the deployment that runs tracking-ingest, and wait until it's running again:
kubectl -n tracking rollout restart deployment/position-feed
kubectl -n tracking rollout status deployment/position-feed --timeout=5m
For the restart to be a success, the line has to drop under 200 ms within a few minutes of running the commands, and the gauge has to turn green.
Show the Logs for One Ship
If the feed is fine, the next question is about the late ship itself: is Lastport still hearing from it? The second step holds a Live Logs block with the tracking-ingest lines for that ship:
{service="tracking-ingest"} | logfmt | vessel="$vessel"
| logfmt reads the fields out of each line, and vessel="$vessel" keeps the lines for one ship.
When the lines show no position received warnings, the ship has gone quiet. In the screenshot, LP-07's positions stop after two satellite link timeouts, and the warnings start. Lastport has a separate runbook for that, Silent Vessels, so the step links to it instead of repeating it.
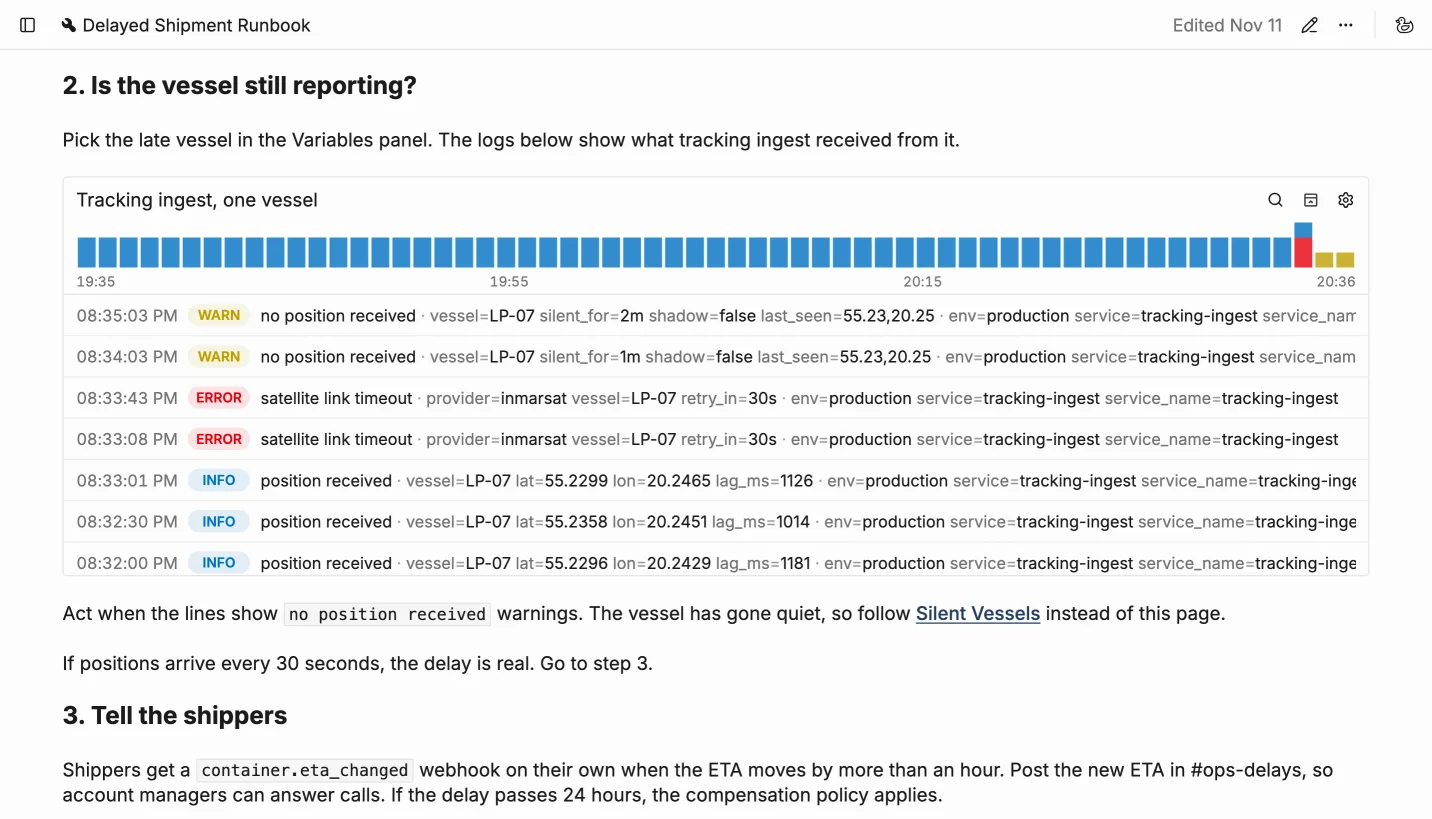
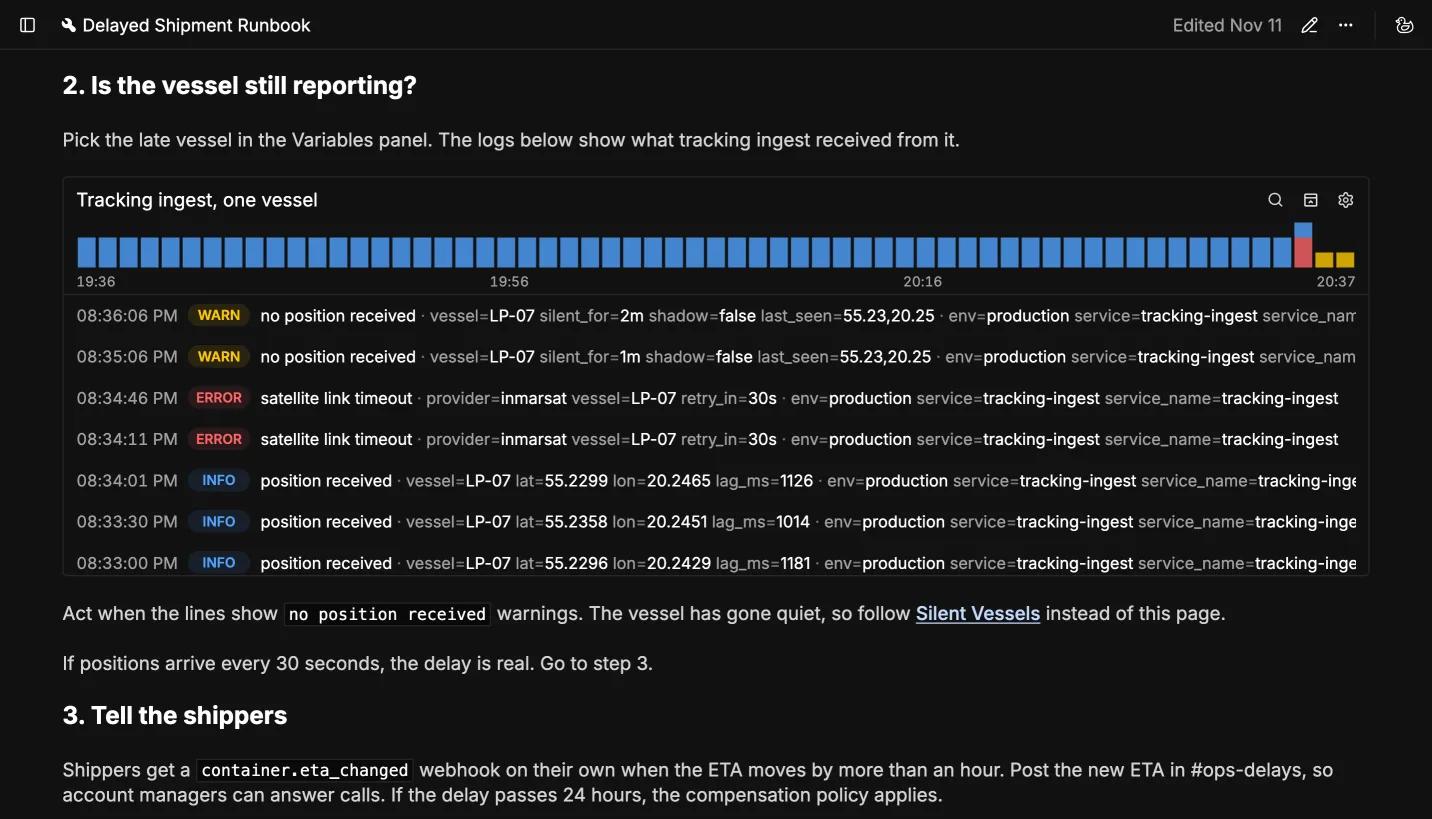 LP-07's last positions, then the link errors and warnings
One Runbook for Every Ship
$vessel in that query is a variable. Lastport has 14 ships, and one page covers all of them. You can set up the same for your own services or hosts. In the sidebar, click Variables, then the pencil to edit them. Under a group of your own, click Add variable. Choose a name and a key you'll recognize later, pick the List type, and add one option per service or host. Any query on a page can then use the key with a $ in front, like $vessel.
Each person picks their own value in the Variables panel. So two engineers can follow the same runbook for two different ships at the same time, without changing it for each other.
Link the Alert to the Page
The fastest way to the runbook is a link in the alert that leads to it. In a Prometheus alerting rule, that link usually goes in the runbook_url annotation. To link to one step instead of the whole page, click the drag handle next to a block and choose Copy Link.
Review Changes Like Code
During an incident, people follow a runbook's steps without second-guessing them, so a wrong step costs more there than on most pages. To have every change reviewed, open Page Options, the ⋯ menu at the top right of the page, and click Make Reviewable. Edits then go to a draft, and the page everyone reads stays the same until a reviewer approves the draft and merges it. With Show Changes on, the draft shows each change. For a chart whose query changed, click its gear icon to see the new query above the old one.
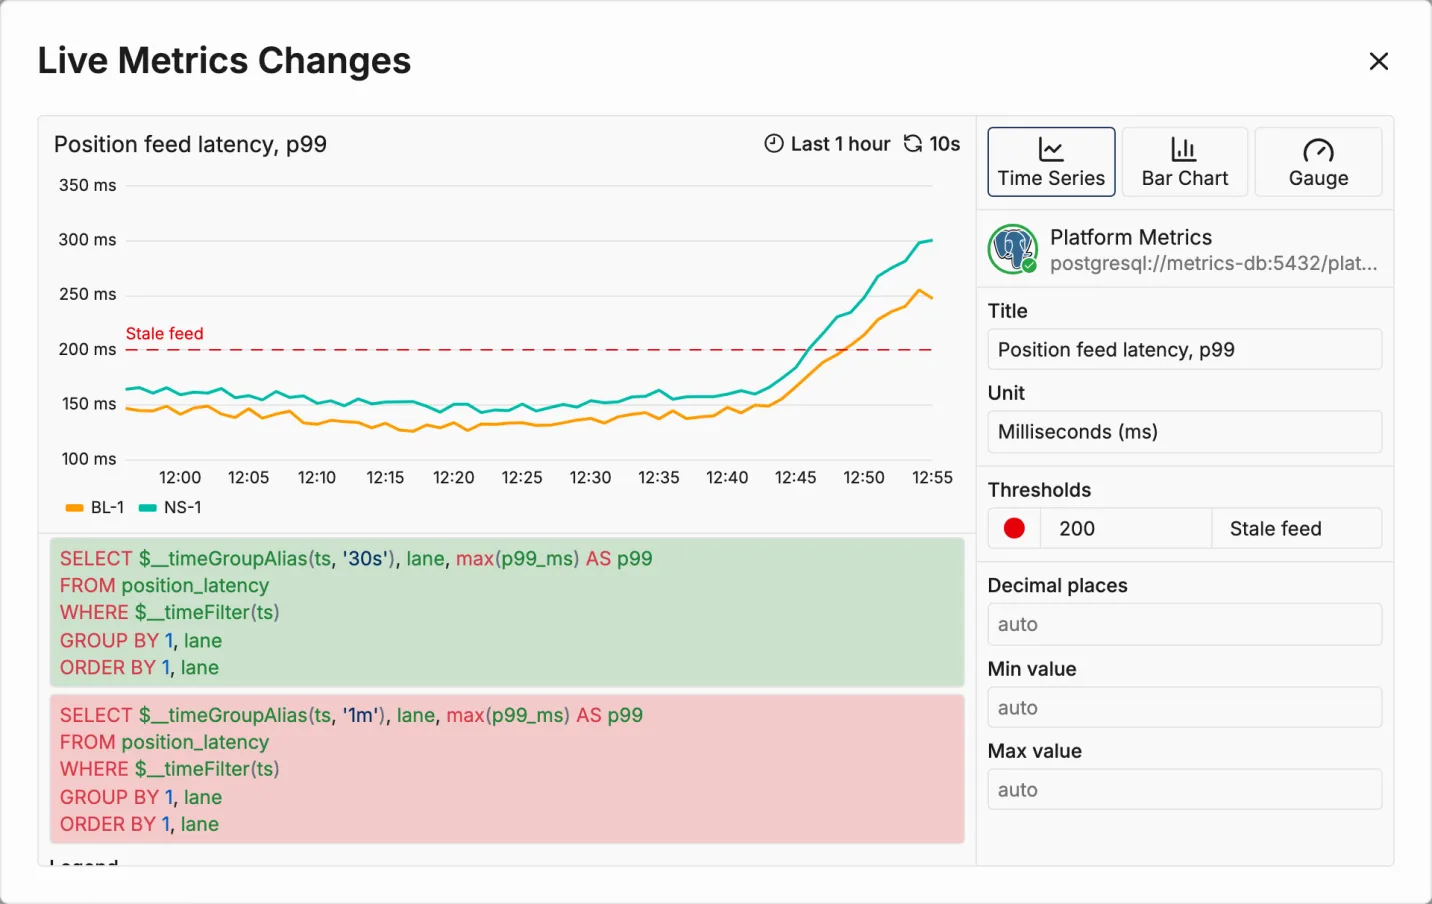
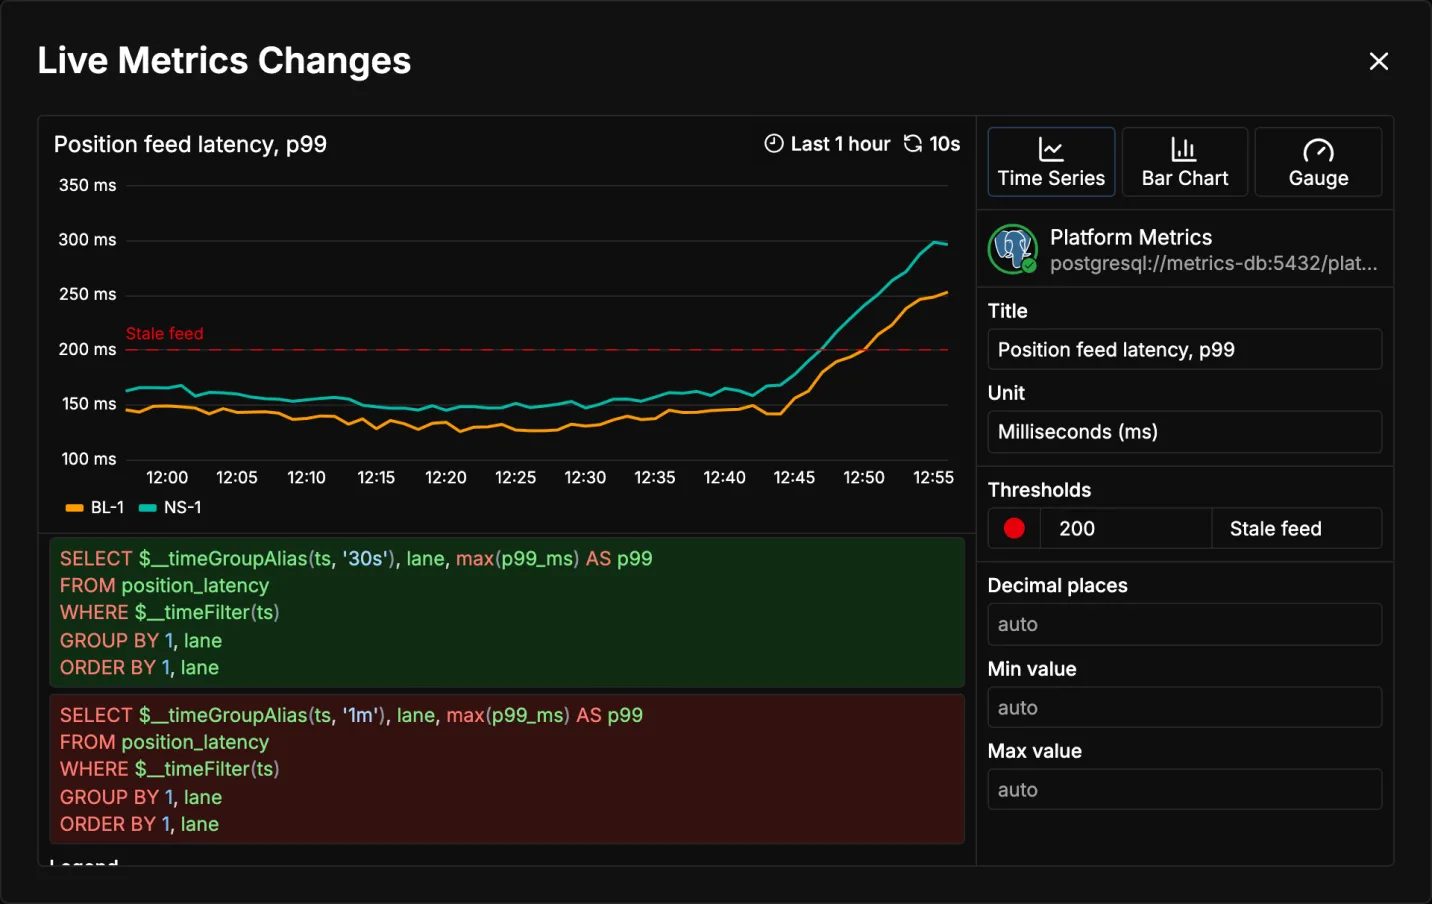 A draft that changes the chart's query, new in green and old in red
Get Reminded When the System Changes
A runbook goes out of date when the system it describes changes and nobody connects that change to the page. A Freshness Hook makes the connection: it reminds the page's maintainers to check the page when something it depends on changes. To add one, hover the page title, click the leaf icon next to it, and click Add Hook. Lastport's runbook would have two:
- GitHub Commits could watch the Kubernetes files of
position-feedin Lastport's repository. When they change, the restart command in the first step might need to change too. - Scheduled Reminder could ask for a read-through every 3 months, even when no files have changed.
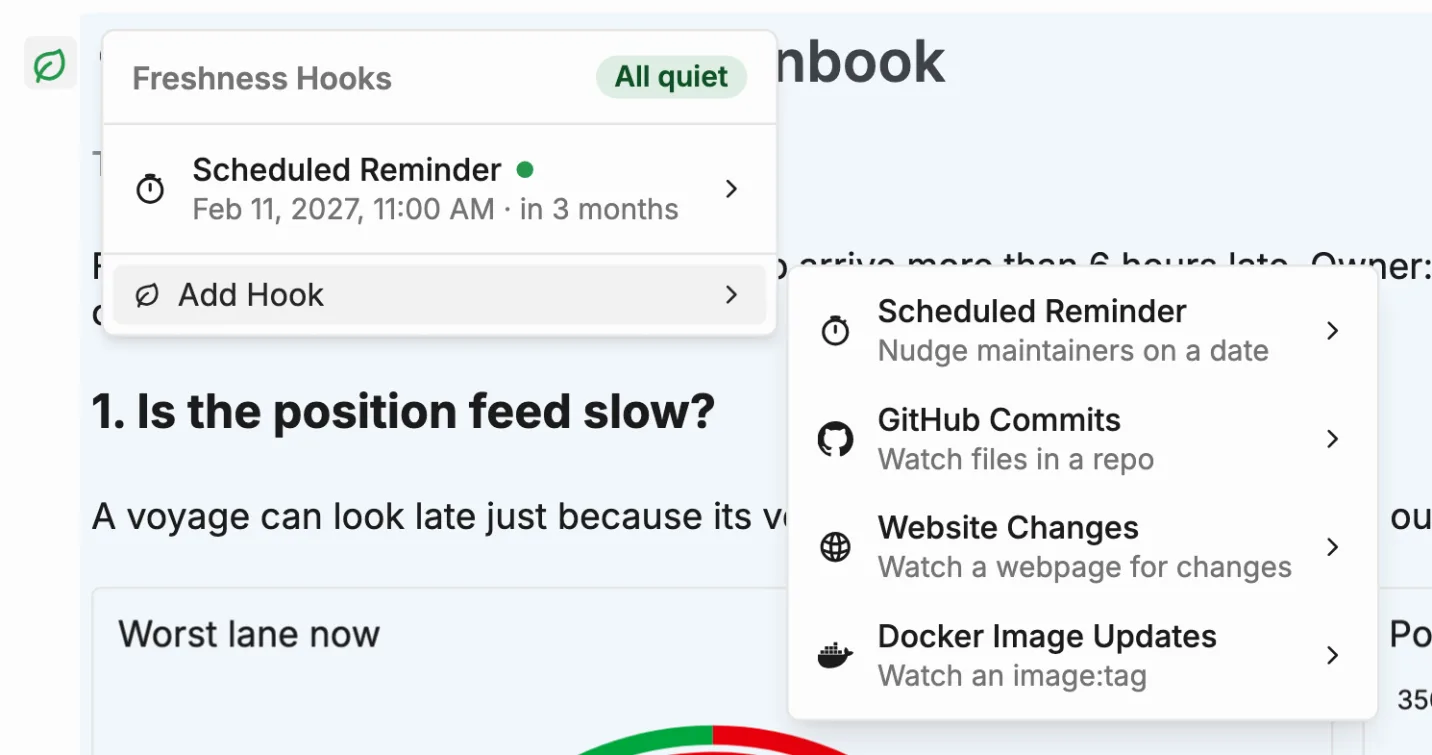
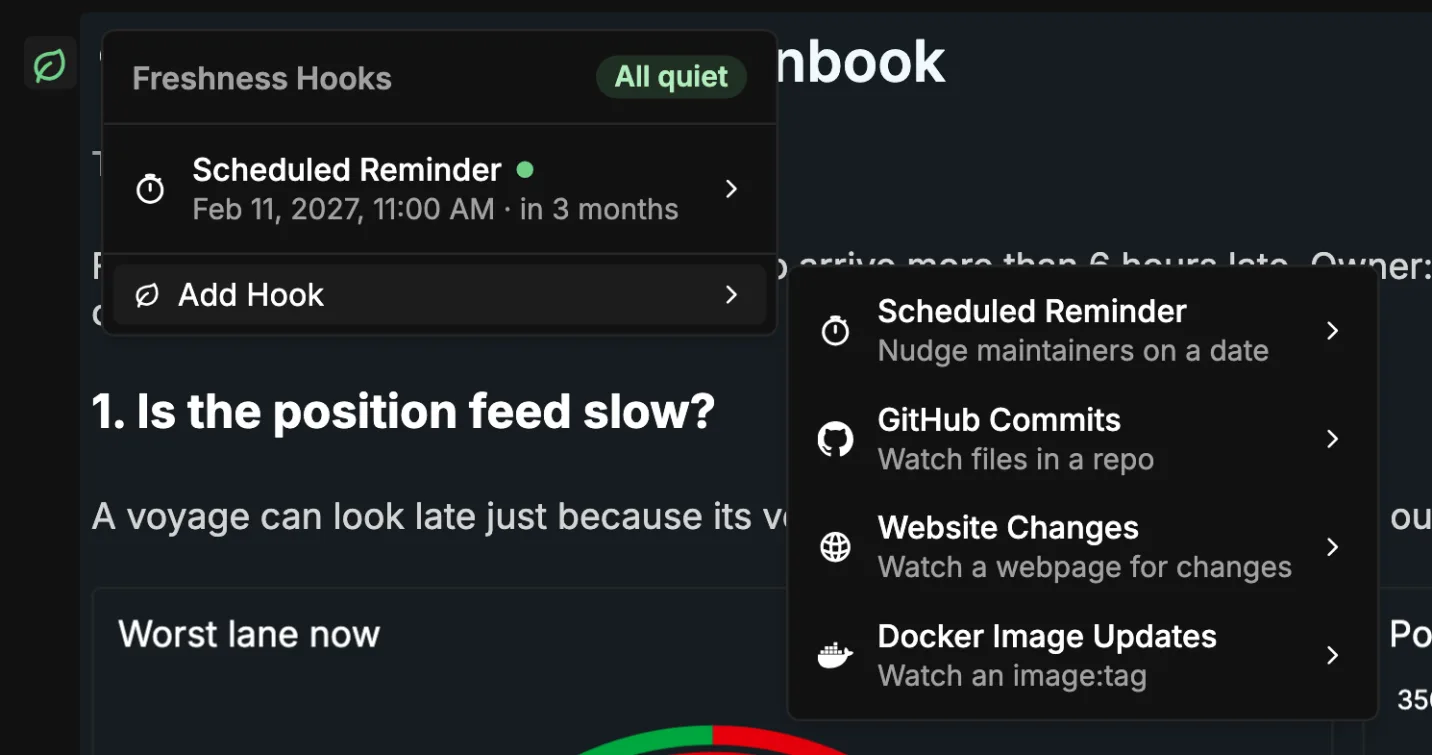 The runbook's scheduled reminder and the hooks you can add
A hook only reminds. Someone still has to read the page and fix it.
The Whole Runbook
Put together, Lastport's runbook reads from top to bottom like the template: when to use it and who owns it, then each step with its chart or logs, the value that means "act", and what to do.
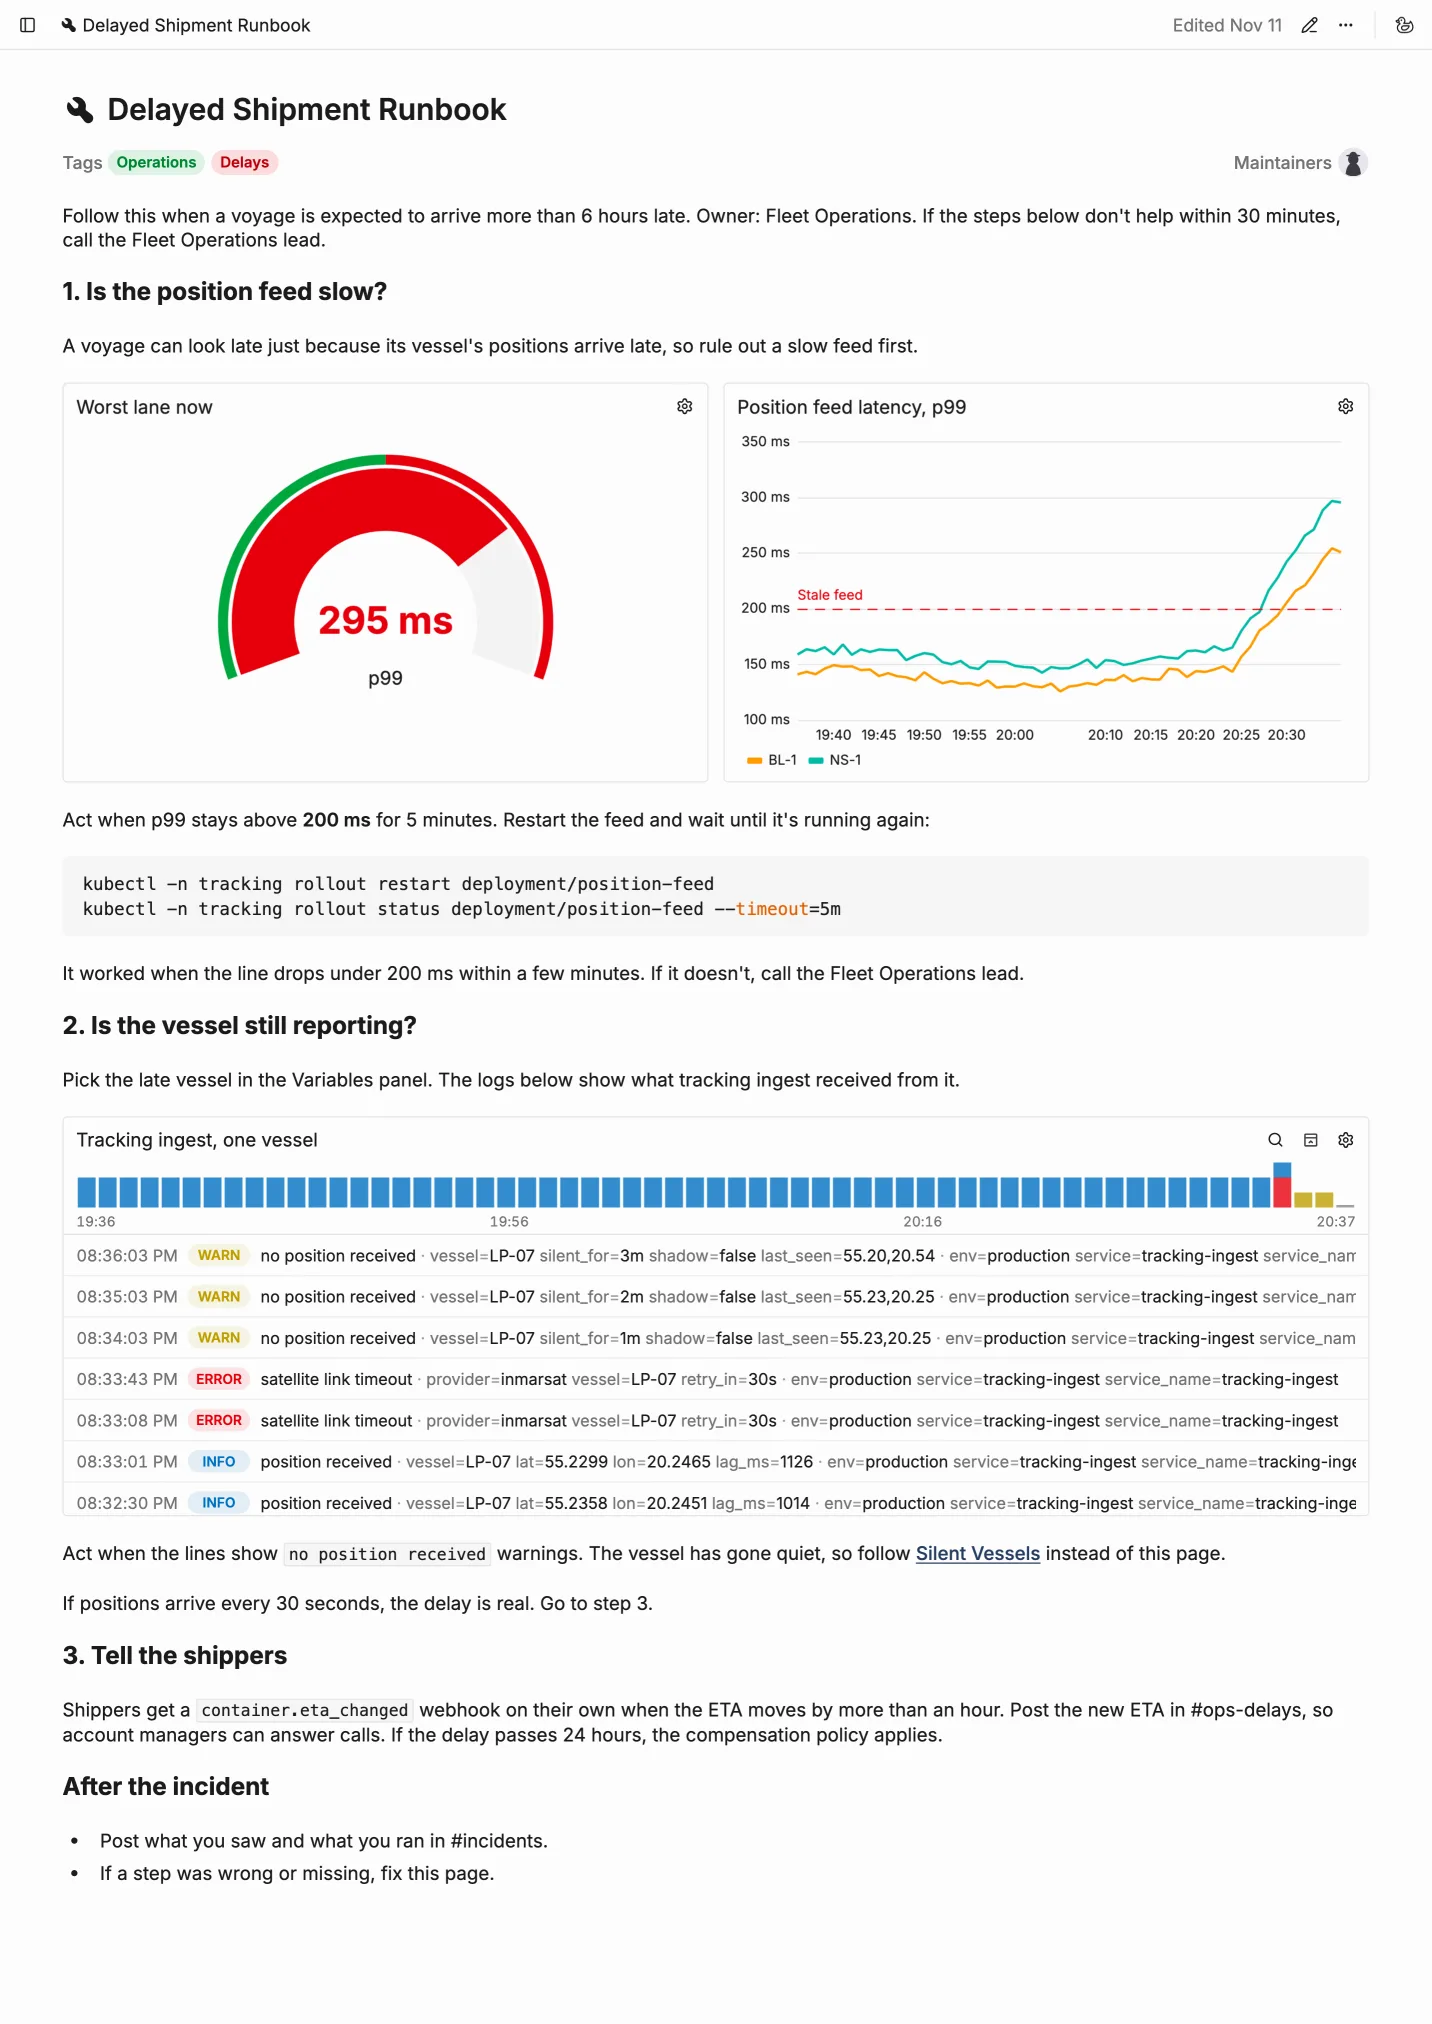
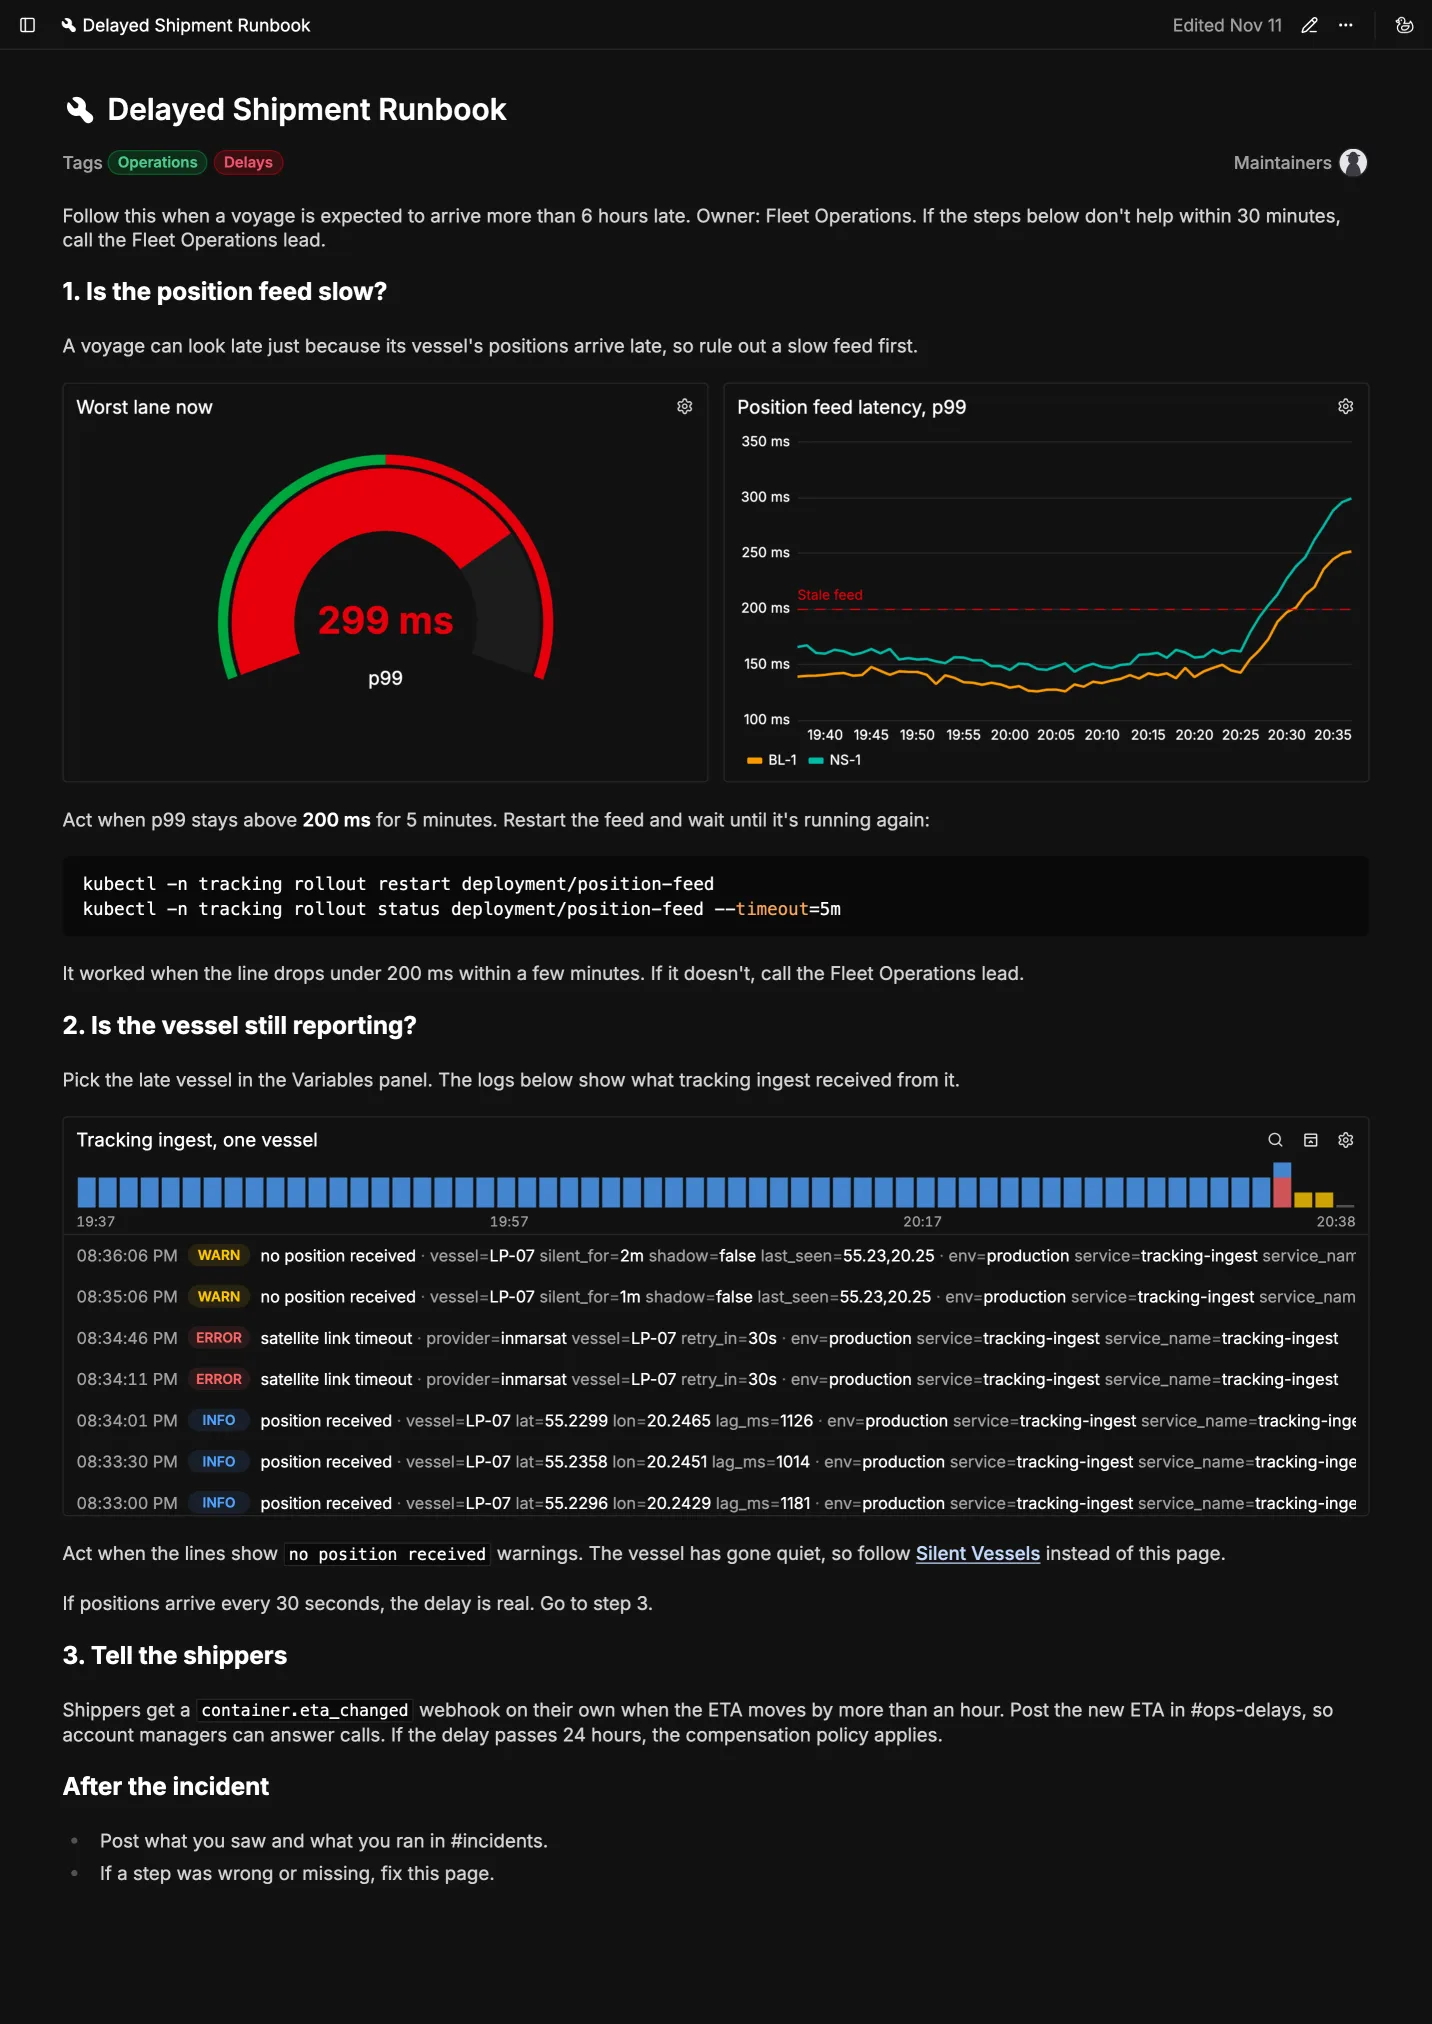 The Delayed Shipment Runbook, from top to bottom
Wrapping Up
A good runbook says when to use it and who owns it. For each step, it says what to look at, when to act, and what to do. In Oxynote, "what to look at" is the chart or the logs themselves, so the on-call engineer can answer each step's question without leaving the page.
A good place to start is the runbook for the alert that pages your team most. Copy the template into it, then add the charts and logs each step needs. To connect your data, see how to connect Prometheus, PostgreSQL, or Loki.
Oxynote is open source and runs as one Docker container: github.com/oxynote/oxynote. If you need help or have a suggestion, come talk to us on Discord.