Dovydas Bykovas8 min read
How to Document a Microservice With a Template and Live Charts
This guide covers what a service page should answer, gives you a template to copy, and builds one in Oxynote, with the service's live charts and logs on the page.
Three questions come up about every service in a microservice setup, usually from someone who didn't build it: who owns it, what it depends on, and whether it's healthy right now. The answers tend to live in different places. The architecture notes are in Confluence or Notion, the API reference is on a generated site, the numbers are in Grafana, and the rest is in someone's head or an old Slack thread. So whoever needs an answer ends up asking in Slack.
This guide covers what a service page should answer, a template you can copy, and a service page built in Oxynote, with the service's live charts and logs on the page itself.
Why Service Docs Stop Being Used
A service page only helps when people open it, and they only open it when they trust it. Simon Willison, who co-created Django, wrote about documentation: "People will only trust it if they know that it is kept up to date."
Most service docs lose that trust the same way. They describe the service as it was when someone wrote them, and nothing tells anyone when the service changes. A diagram still shows a queue that was removed, or a page links to a dashboard that was renamed. After the first wrong answer, people go back to asking in Slack.
Google's documentation guide suggests keeping fewer docs, and keeping them accurate:
A small set of fresh and accurate docs is better than a large assembly of "documentation" in various states of disrepair.
So a good service page is short, answers the questions people ask, and has a way to stay accurate.
What a Service Page Should Answer
A service page answers those three questions, and three more that come up once someone works with the service. Each gets a section:
- Owner and on-call: the team, the rotation, and who to call when the on-call engineer can't help.
- Dependencies: the services and databases it relies on, and the ones that break when it breaks.
- API: how to call it, with an example request.
- Metrics and logs: the few that show whether it's healthy, and the value that means "act".
- Configuration and deployment: the settings that matter, where it runs, and how a release goes out.
- Recovery: what to do when it fails, or a link to the runbook that explains it.
The first two belong at the top of the page, where they show without scrolling. They're what an on-call engineer from another team needs when an alert about your service wakes them up. Google's guide asks the same of a README: "Who maintains this directory and where I can learn more?"
A Service Page Template to Copy
The template below works in any tool that stores text, such as Confluence, Notion, or a README.md next to the code:
# <Service name>

<What it does and who uses it, in two sentences.>

## Owner and On-Call

Owned by <team>. On-call: <rotation and channel>.
If the steps below don't help within <time>, call <who>.

## Dependencies

Upstream: <what it reads from or receives from>.
Downstream: <what reads from it or calls it>.

<A diagram of the above.>

## API

<Each endpoint: what it does, its parameters, and an example request.>

## Metrics and Logs

Look at: <chart>, last <time range>.
Act when: <threshold>, such as p99 above 200 ms for 5 minutes.
Logs: <query for warnings and errors>.

## Configuration

<The settings that change its behavior, with their current values.>

## Deployment

<Where it runs, the image, and how a release rolls out.>

## Recovery

- <Failure>: <what to do, or a link to the runbook>.
In most tools, "Metrics and Logs" ends up as a link to a Grafana dashboard. The link works until the dashboard is renamed, and the threshold written under it drifts away from the one on the chart.
Build It in Oxynote
Oxynote is a wiki whose pages query your Prometheus, PostgreSQL, MySQL, or Loki directly. So in Oxynote, "Metrics and Logs" can be the chart and the logs themselves, and the owner, dependencies, and API sit around them on the same page.
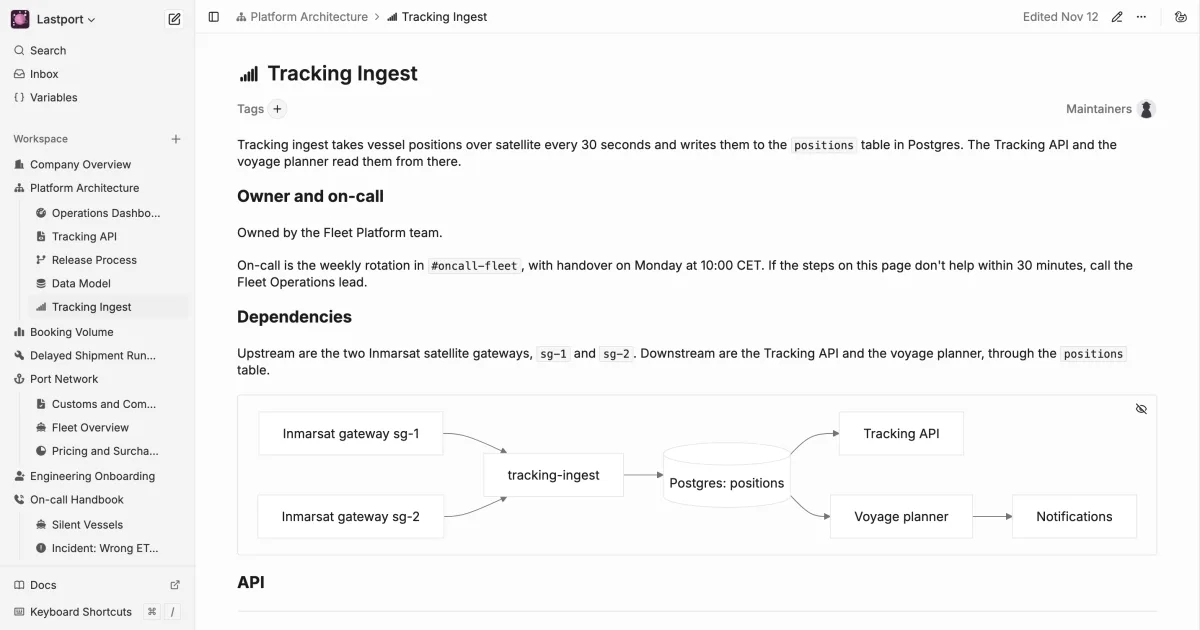
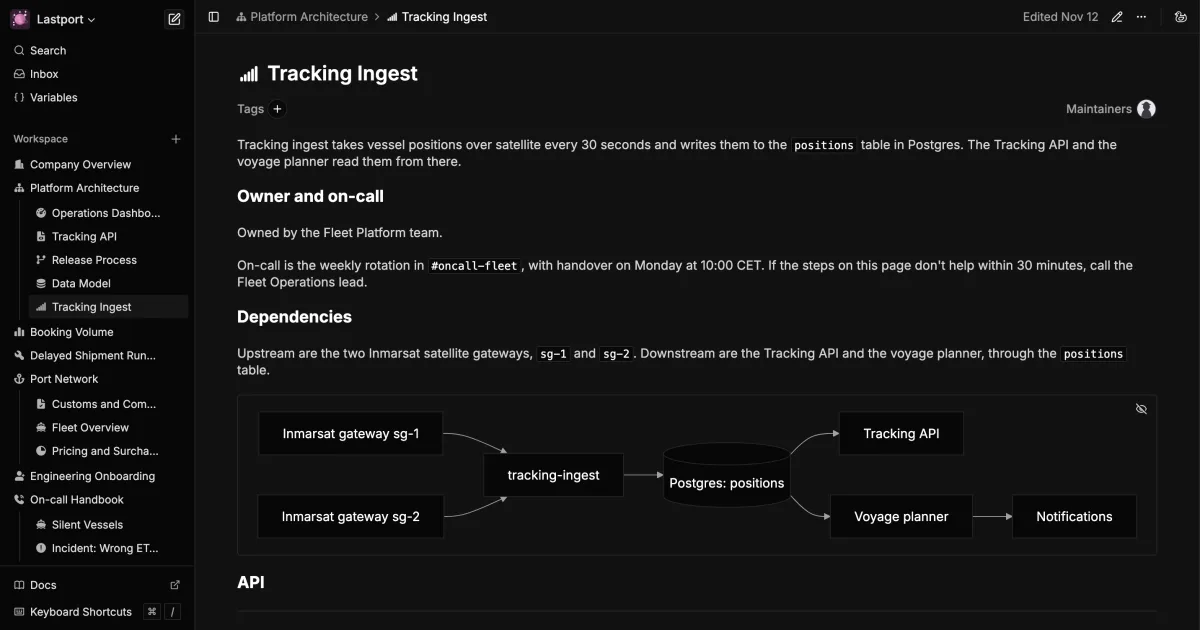
The following screenshots come from a demo workspace for Lastport, a made-up shipping company. Its ships report their position over satellite every 30 seconds, and a service called tracking-ingest receives the positions and writes them to Postgres. The service's page follows the template.
Name the Owner
The page header lists the page's maintainers. They get a notification when someone comments on the page, and they get its reminders, which a later section covers. The team and the on-call rotation should go in a separate space allocated within the page, such as "Owner and On-Call", since a rotation changes more often than the people who keep the page.
Draw the Dependencies
A diagram answers "what does it talk to" faster than a paragraph. Type / on an empty line and pick Mermaid Diagram, then write the diagram as Mermaid source. Lastport's is a flowchart from the satellite gateways, through the service and its database, to the services that read from it:
flowchart LR
  sg1["Inmarsat gateway sg-1"] --> ingest["tracking-ingest"]
  sg2["Inmarsat gateway sg-2"] --> ingest
  ingest --> db[("Postgres: positions")]
  db --> api["Tracking API"]
  db --> planner["Voyage planner"]
  planner --> notifications["Notifications"]
Because the diagram is text, a change to it shows up in a review like any other line, and it's indexed by search.
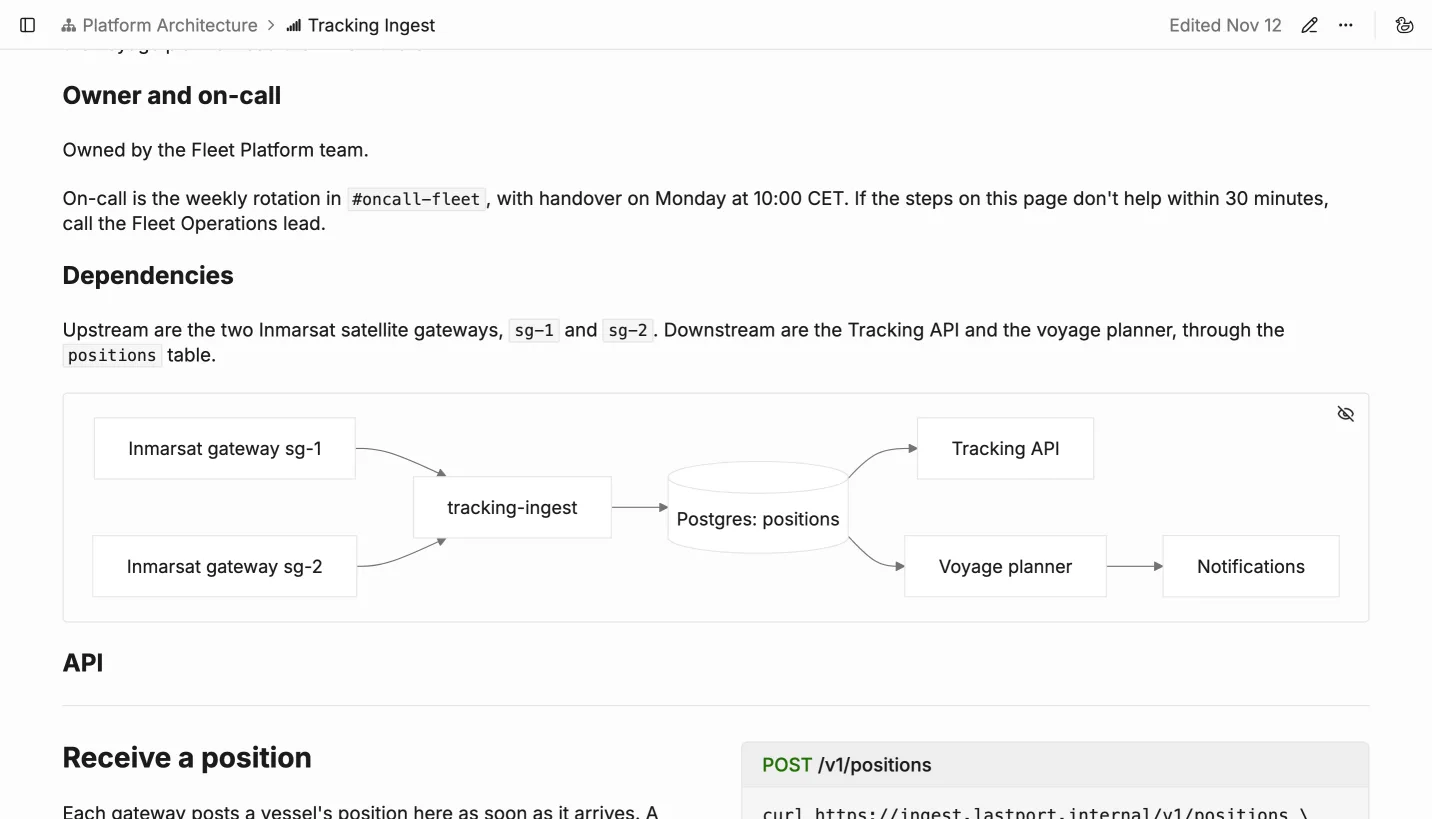
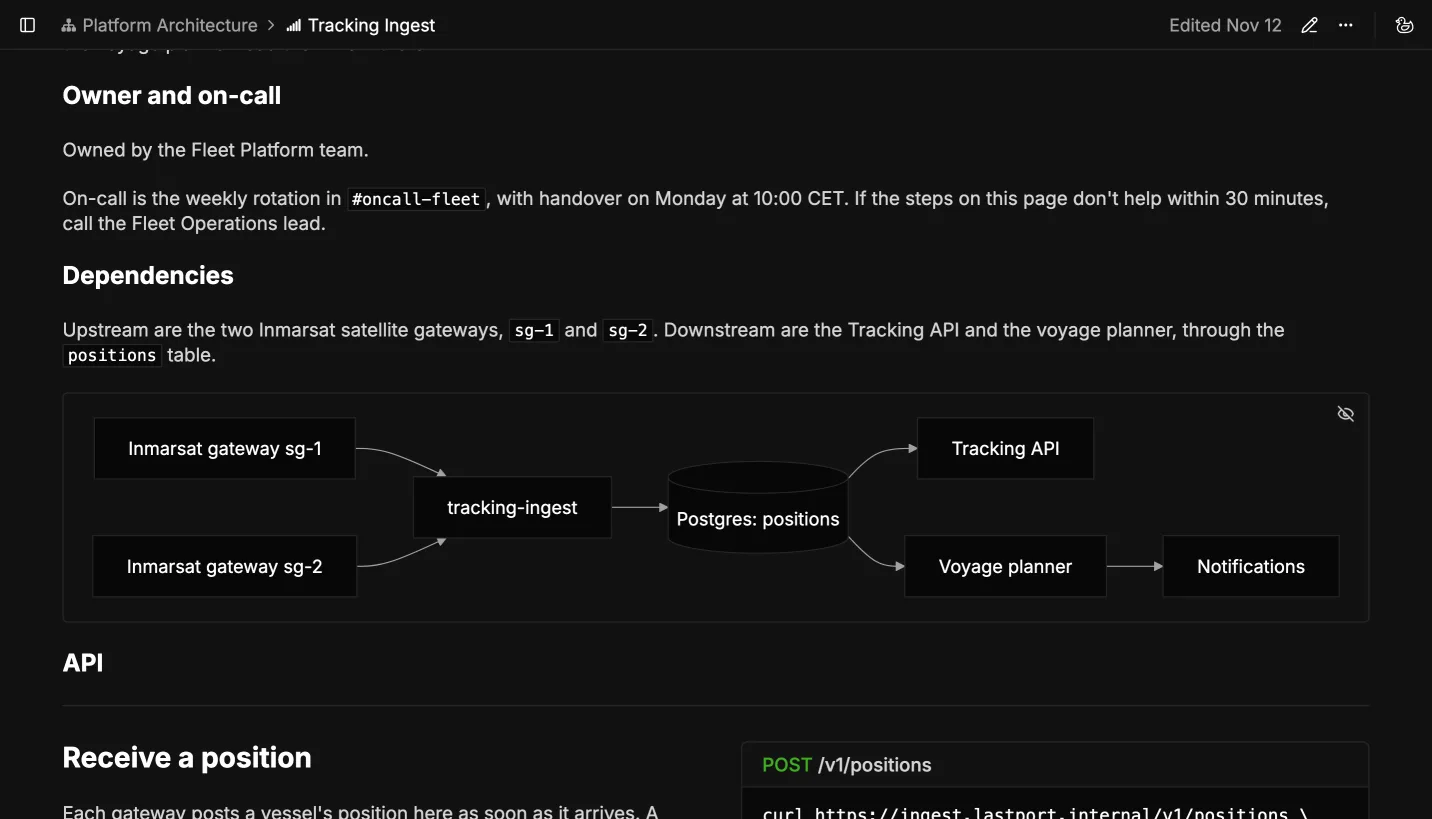 The owner, the on-call rotation, and what the service talks to
Put the API Next to Its Example
Type || to add a Split Documentation block. The left side is for the documentation itself, and it has a separate place for parameters and their types. The right side is for what goes with it, such as an example request, a live chart, or a diagram. So the reader sees the parameters and a request they can copy side by side.
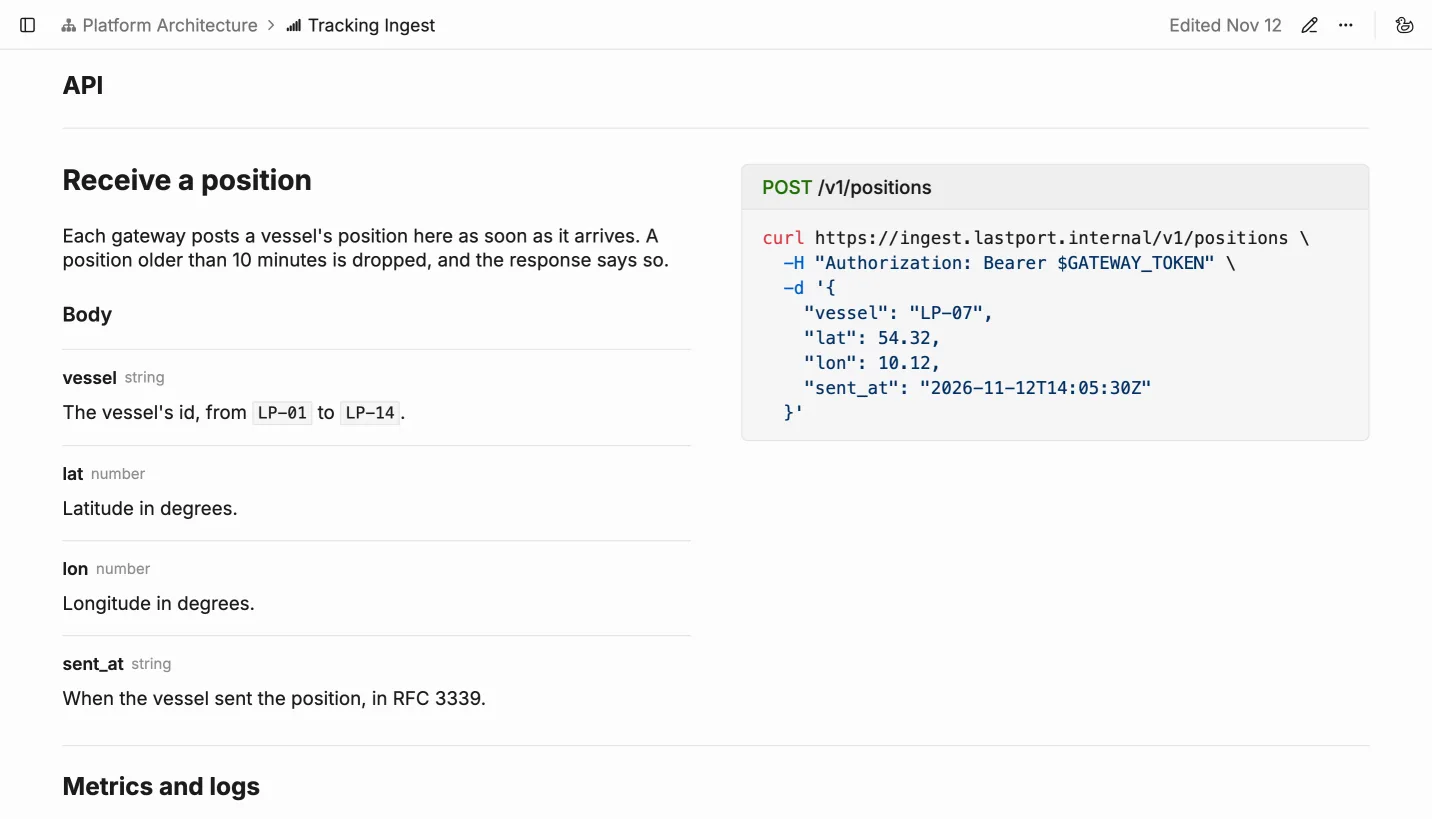
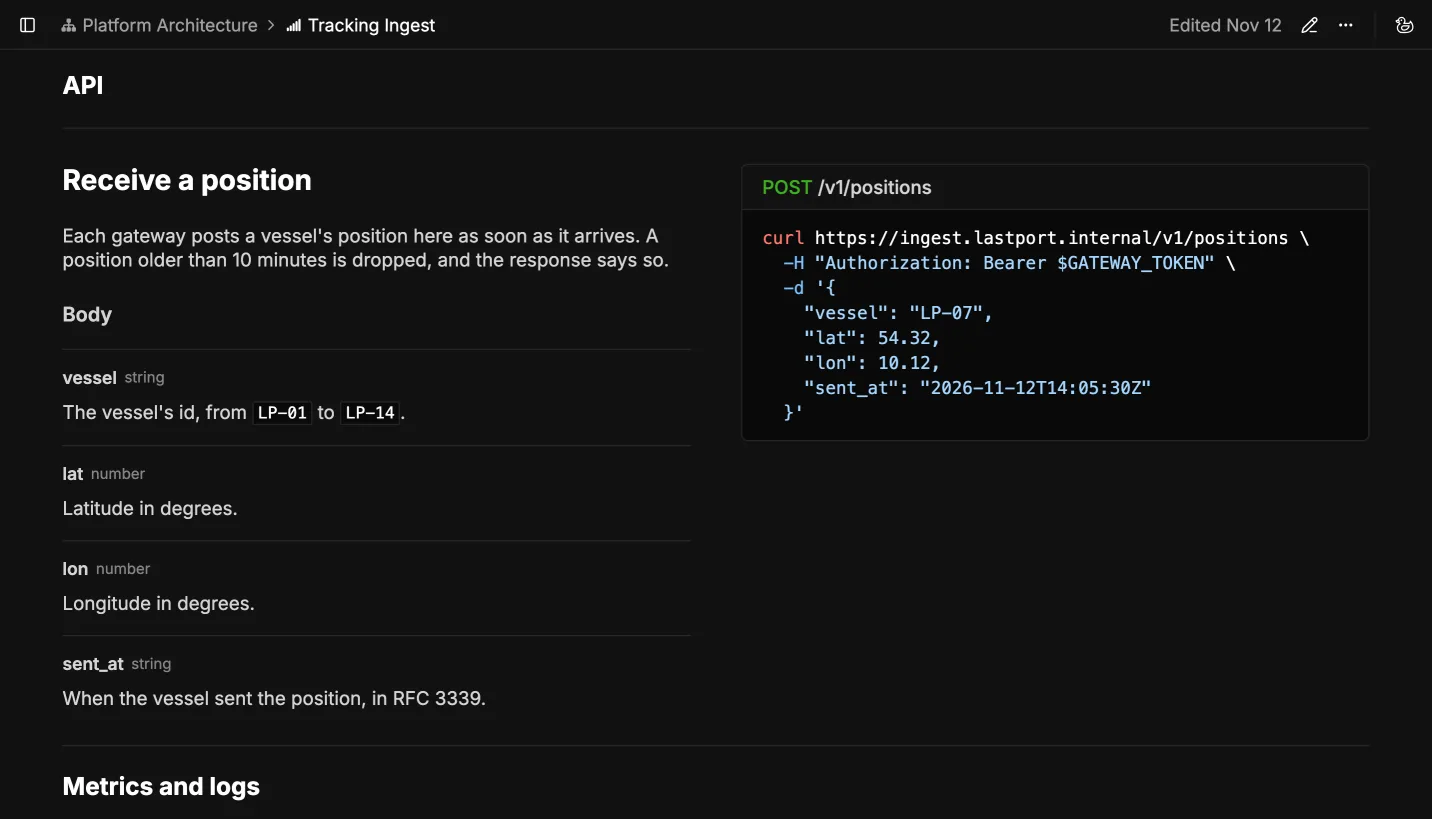 The endpoint's parameters next to an example request
Show How It's Doing Now
Type %% to add a Live Metrics block. Lastport's chart runs a SQL query against a latency table in Lastport's PostgreSQL database:
SELECT $__timeGroupAlias(ts, '1m'), lane, max(p99_ms) AS p99
FROM position_latency
WHERE $__timeFilter(ts)
GROUP BY 1, lane
ORDER BY 1, lane
The PostgreSQL guide explains the $__ macros.
The "Act when" from the template goes on the chart as a threshold, a red line at 200 ms labeled Stale feed. To add one to your own chart, click its gear icon, and under Thresholds, click Add Threshold.
Under the chart, a Live Logs block from the slash menu shows only the service's warnings and errors from Loki:
{service="tracking-ingest"} | logfmt | level=~"warn|error"
With both on the page, a reader sees how the service is doing now. A chart for a service that stopped sending data shows up empty, instead of a number someone copied into the page weeks ago.
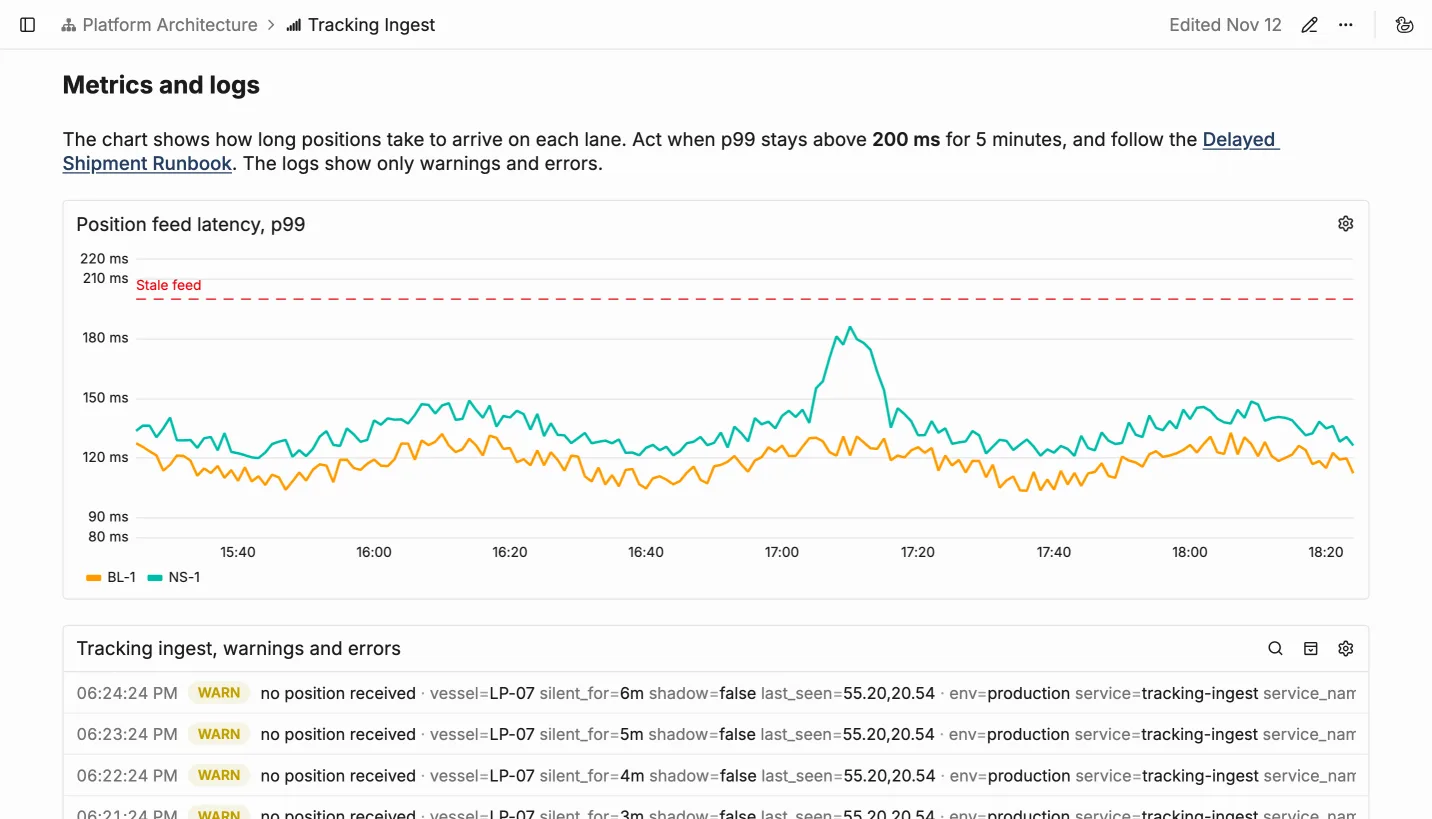
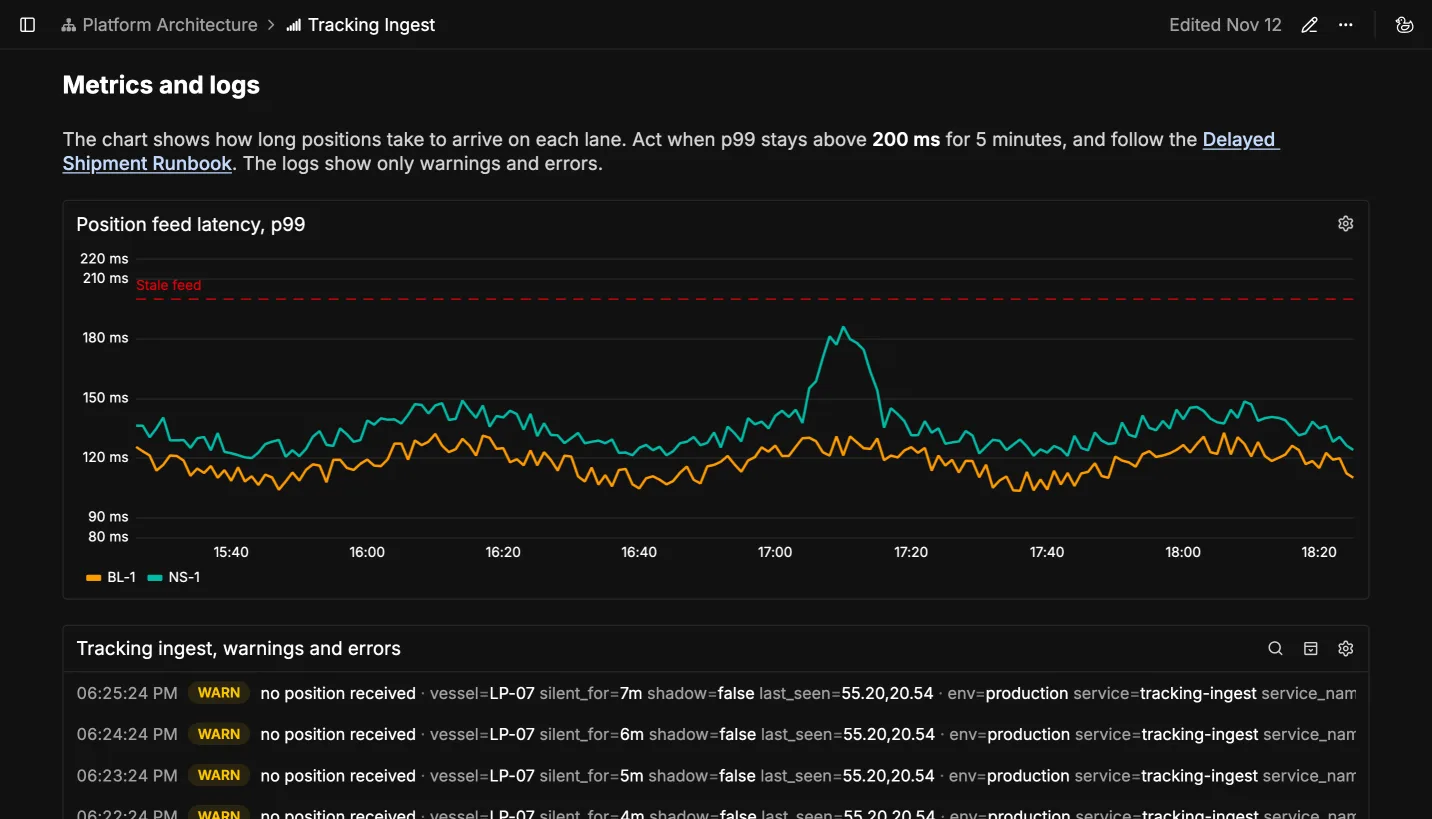 The service's latency and its warnings, live on the page
Find It With Search
Press ⌘K (Ctrl+K on Windows and Linux) to search every page in the workspace. Search indexes every block on a page, including code blocks, Mermaid definitions, and the titles of charts and logs. It groups the results by page, and opening a result jumps to the matching block. A search for rollout status finds the deploy command on the service page and in the runbook, and the rollout section of the release process.
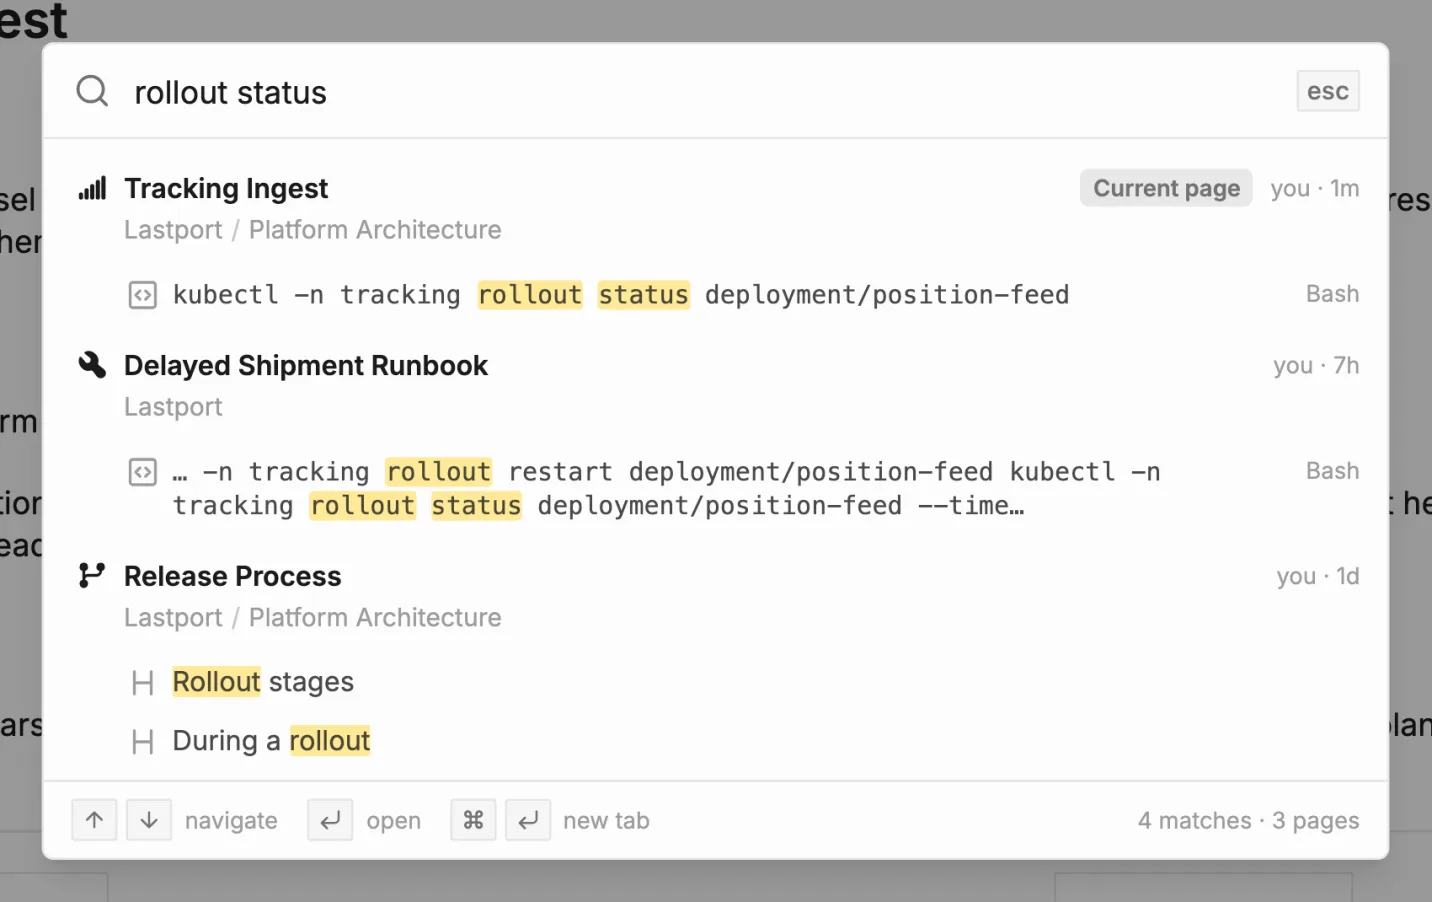
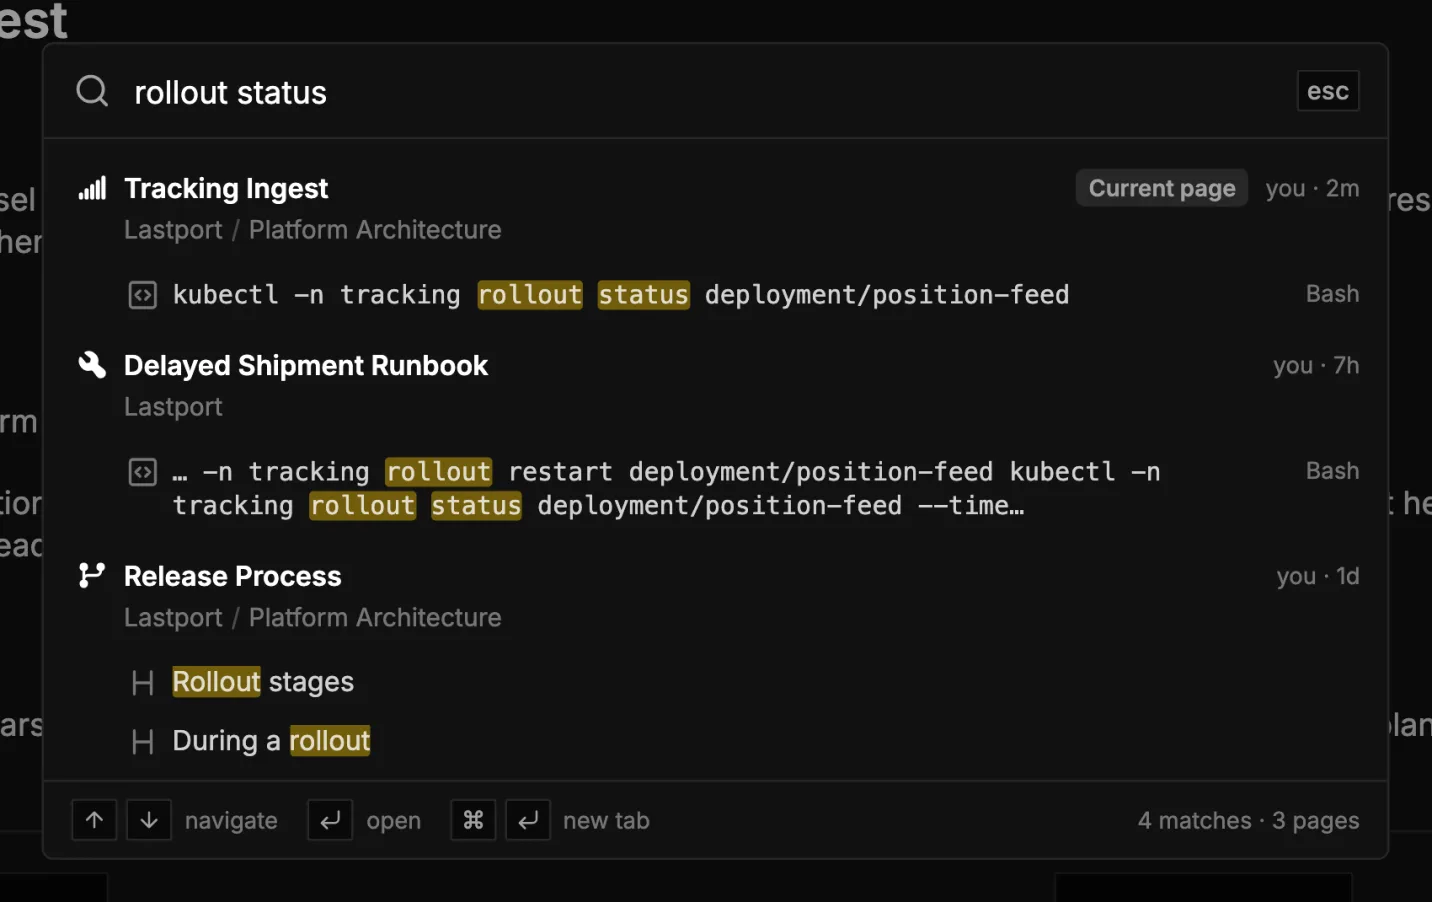 A search for rollout status, with matches grouped by page
Review Changes Like Code
Simon Willison also wrote this, about docs kept in a repository:
Documentation changes should be reviewed in the same way as your code.
To have every change reviewed, open Page Options, the ⋯ menu at the top right of the page, and click Make Reviewable. Edits then go to a draft, and Show Changes marks each change in red and green where it sits, across every block it touches.
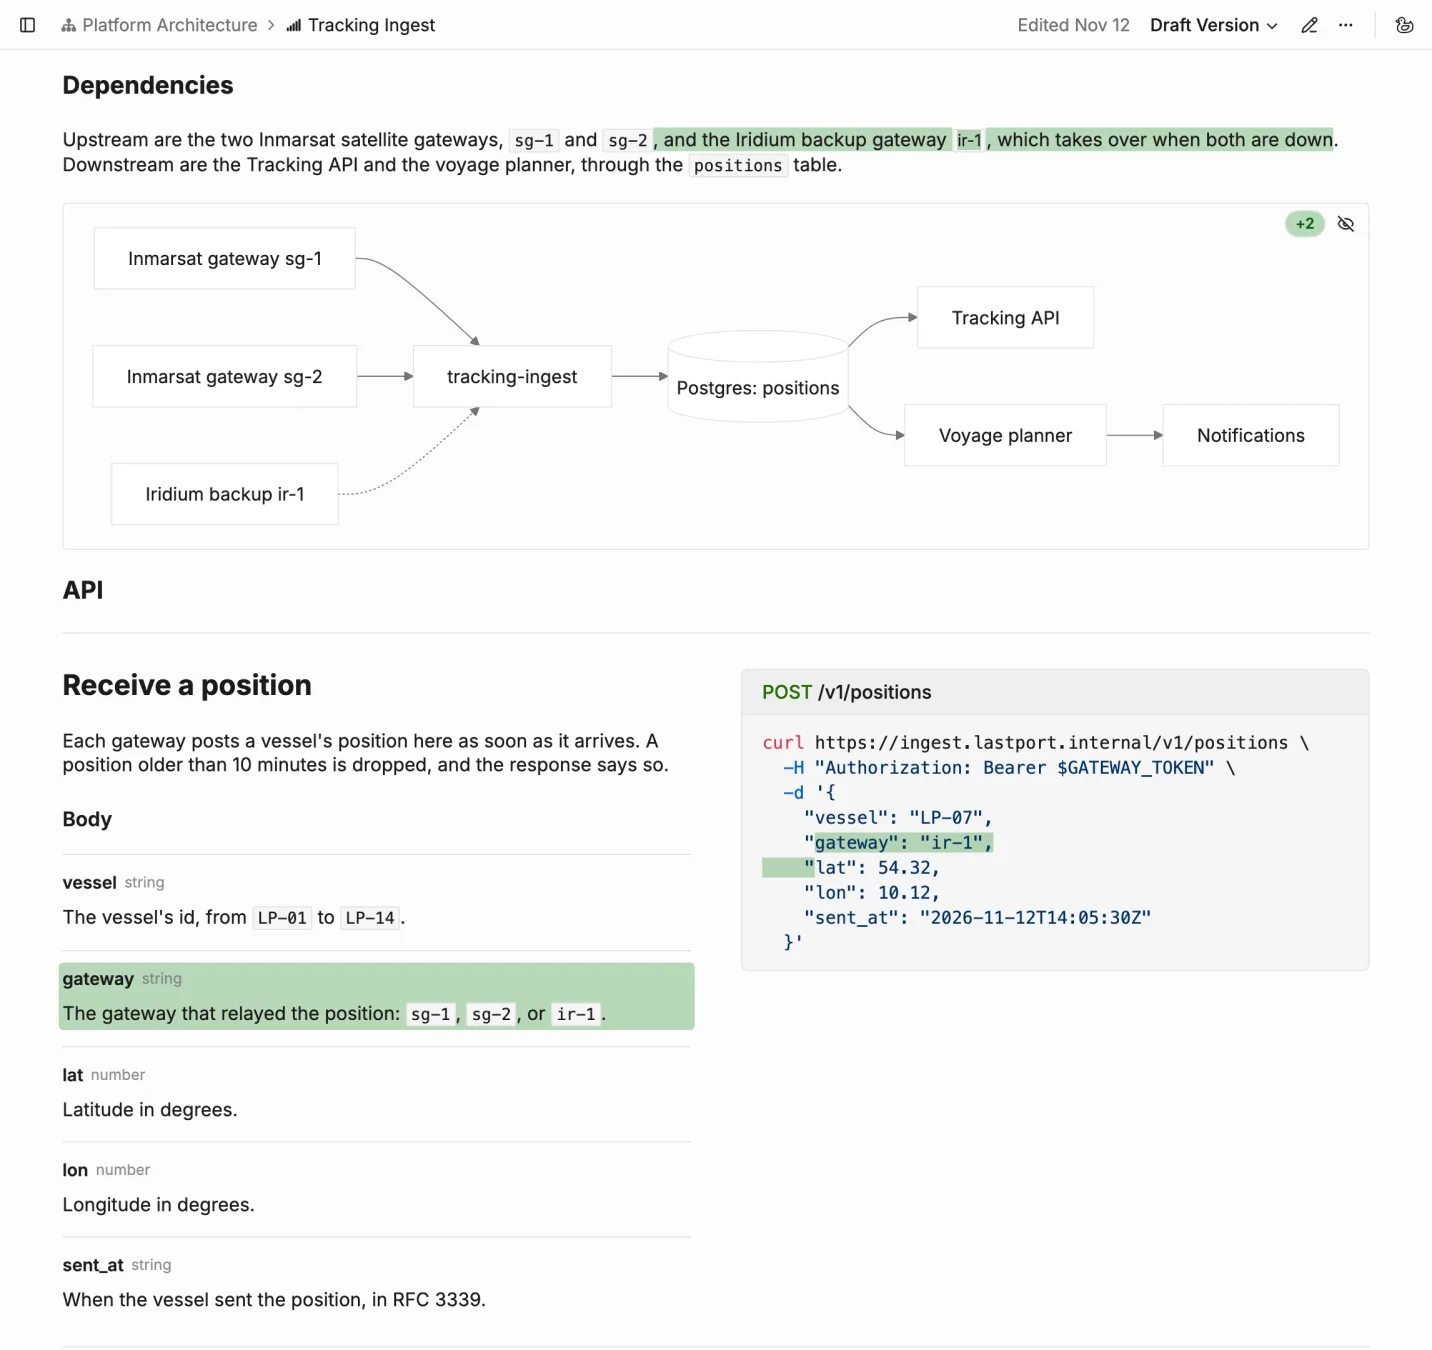
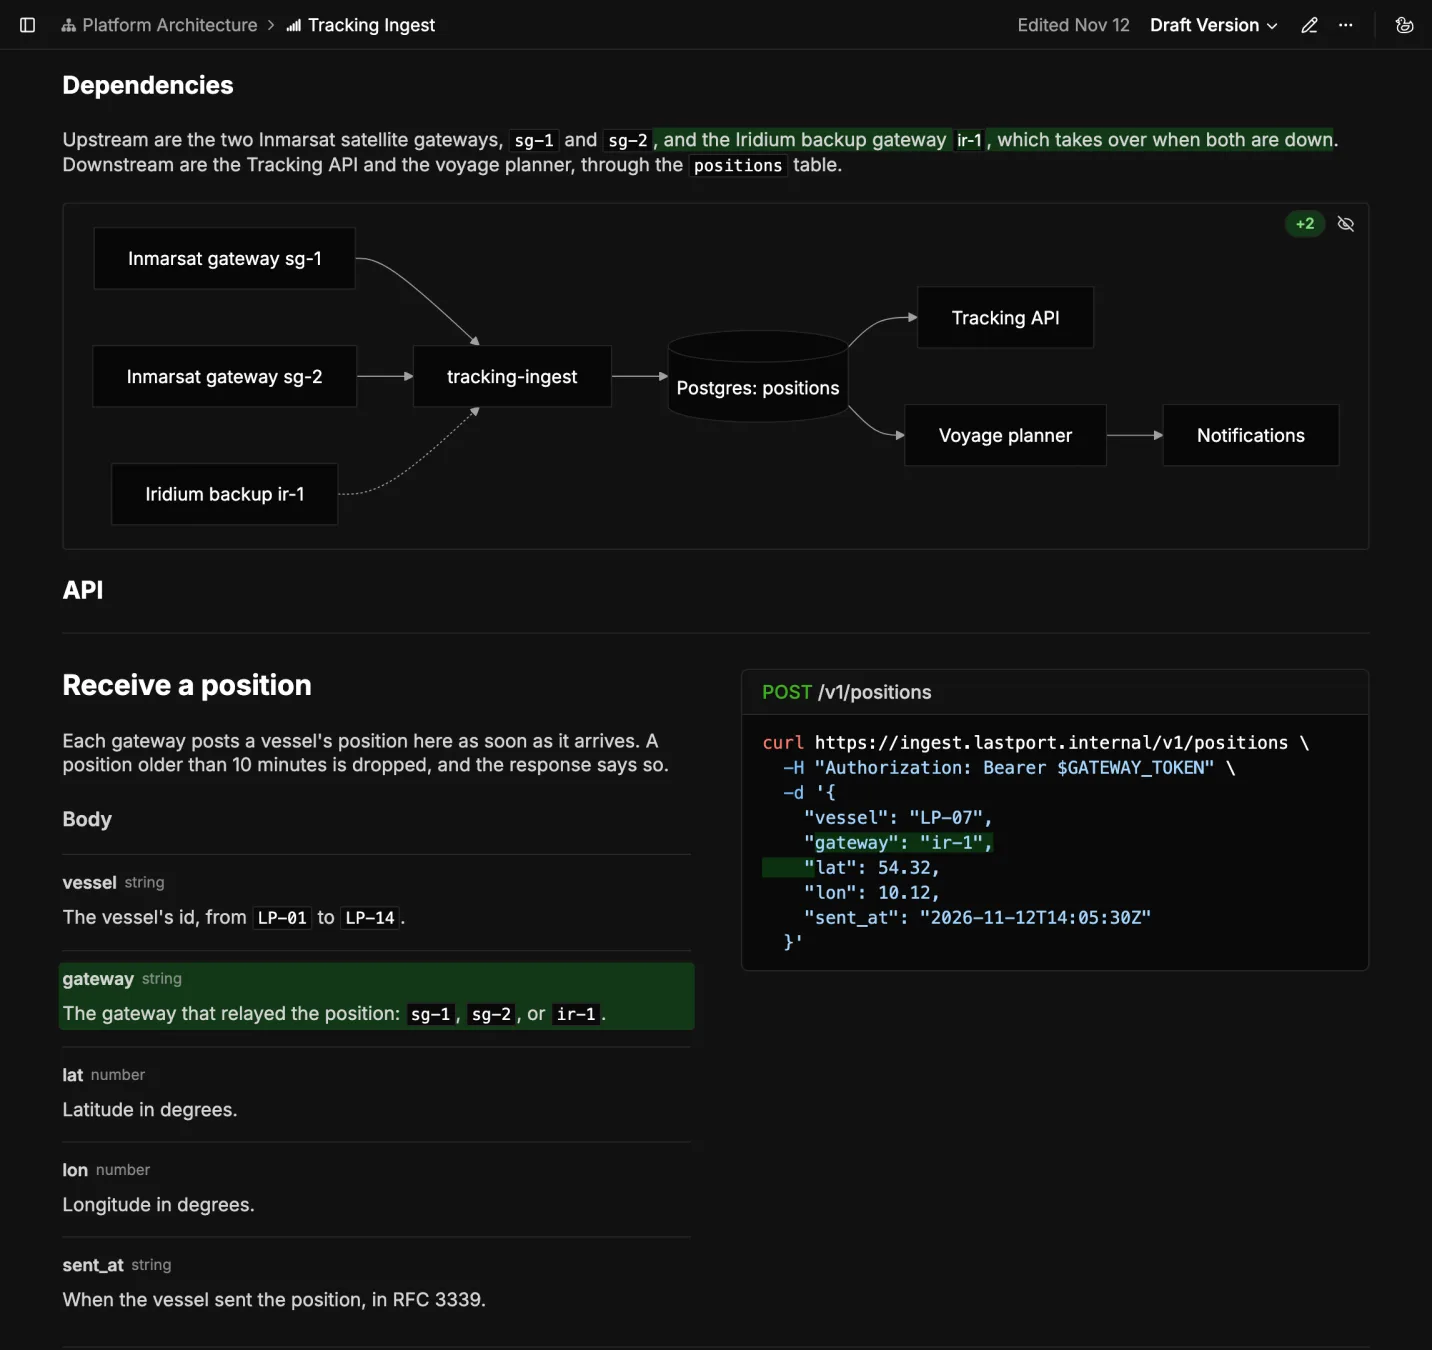 A draft that adds a backup gateway, marked in each block it changes
Approving and merging are separate steps. A reviewer clicks Approve Draft, and an editor clicks Merge Draft into Main when it's time. So a page change can be approved with the code change and merged when the release goes out, instead of describing a service that isn't deployed yet.
Get Reminded When What It Describes Changes
A service page goes out of date when the service changes and nobody connects that change to the page. A Freshness Hook makes the connection: it reminds the page's maintainers to check the page when something it depends on changes. To add one, hover the page title, click the leaf icon next to it, and click Add Hook. Here are some examples:
- Docker Image Updates watches an image tag in a public registry and triggers when the tag points to a new image. Lastport's page watches
postgres:17, so a new minor release of Postgres 17 reminds the maintainers to check the Configuration and Recovery sections. - GitHub Commits watches files in a repository, such as the service's Kubernetes manifests or its OpenAPI file. It's available once your Oxynote server has GitHub set up and you've connected your GitHub account in Oxynote's settings.
- Website Changes watches a web page, such as a vendor's API reference. It needs a changedetection.io server, a self-hosted tool that checks web pages for changes, connected to Oxynote.
- Scheduled Reminder asks for a read-through on a date, even when nothing has changed.
When a hook triggers, the maintainers get a notification in their Inbox, and in Slack too if your workspace and their account are connected. The leaf icon next to the title changes color, so readers can see that the page may be out of date.
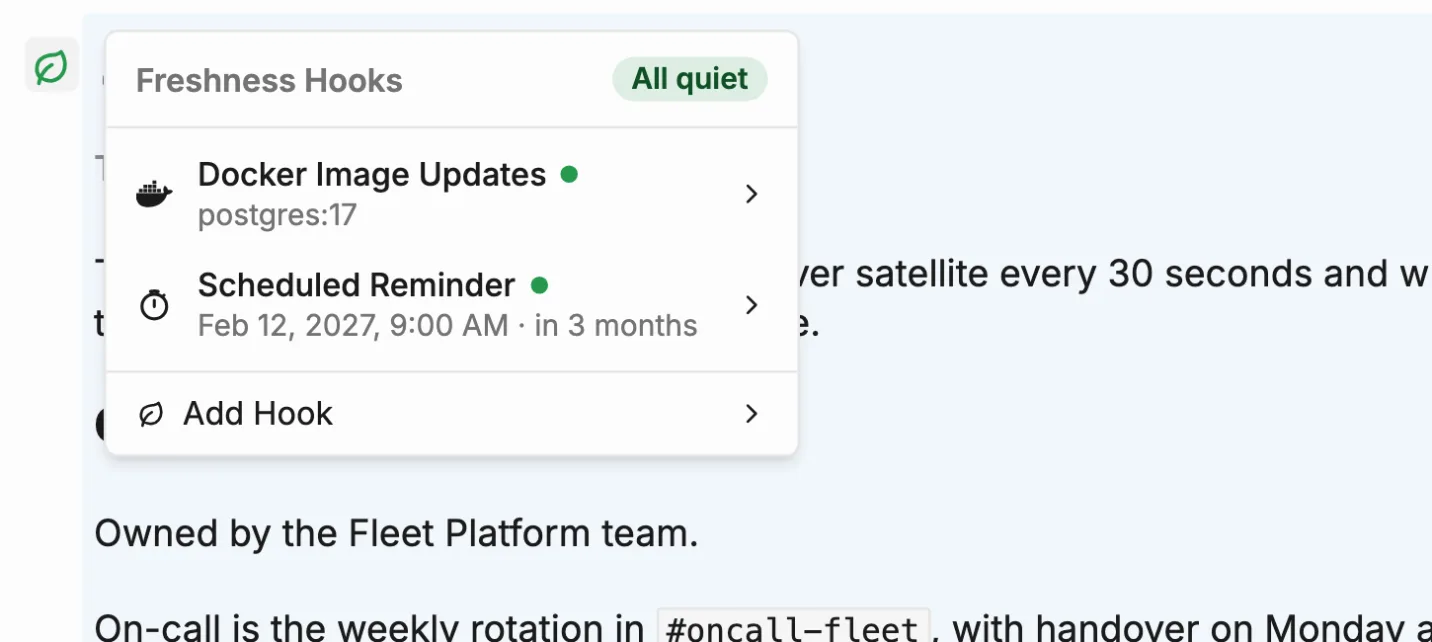
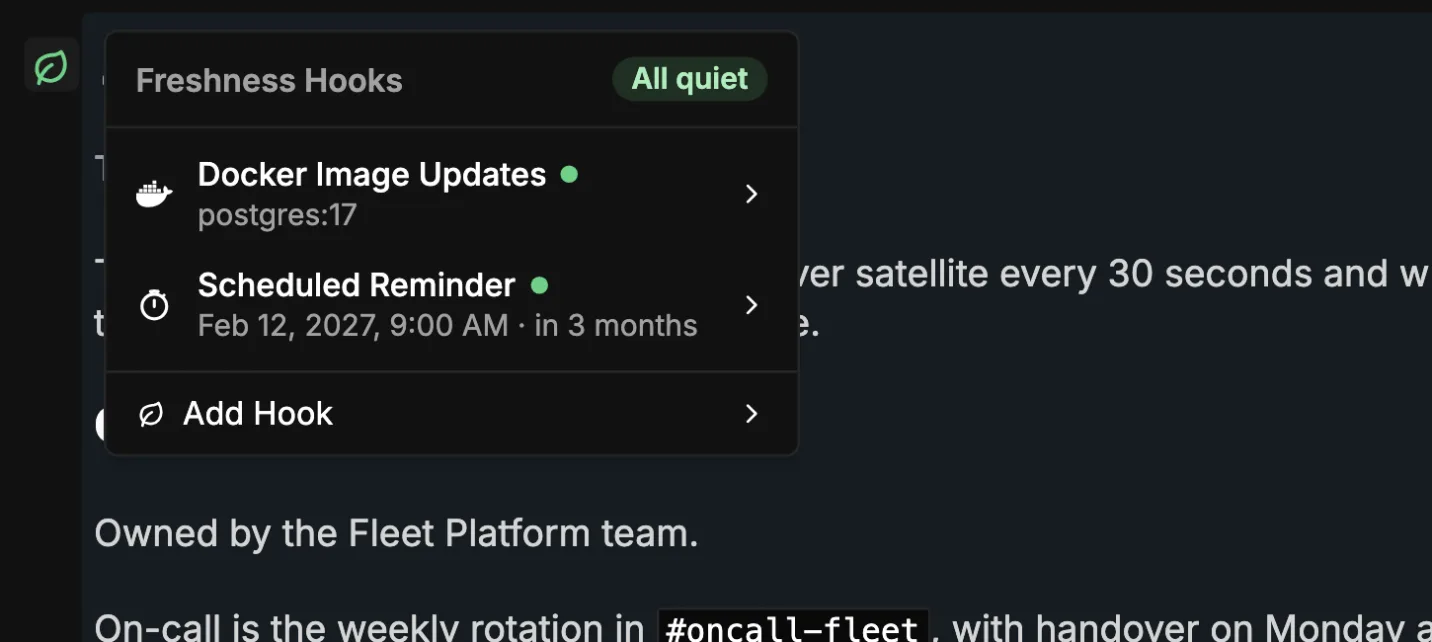 The page's hooks: the database image and a reminder
A hook only reminds. Someone still has to read the page and fix it.
The Whole Page
Put together, Lastport's service page reads from top to bottom like the template: who owns it and what it depends on, then the API, the live chart and logs, and how it's configured, deployed, and recovered.
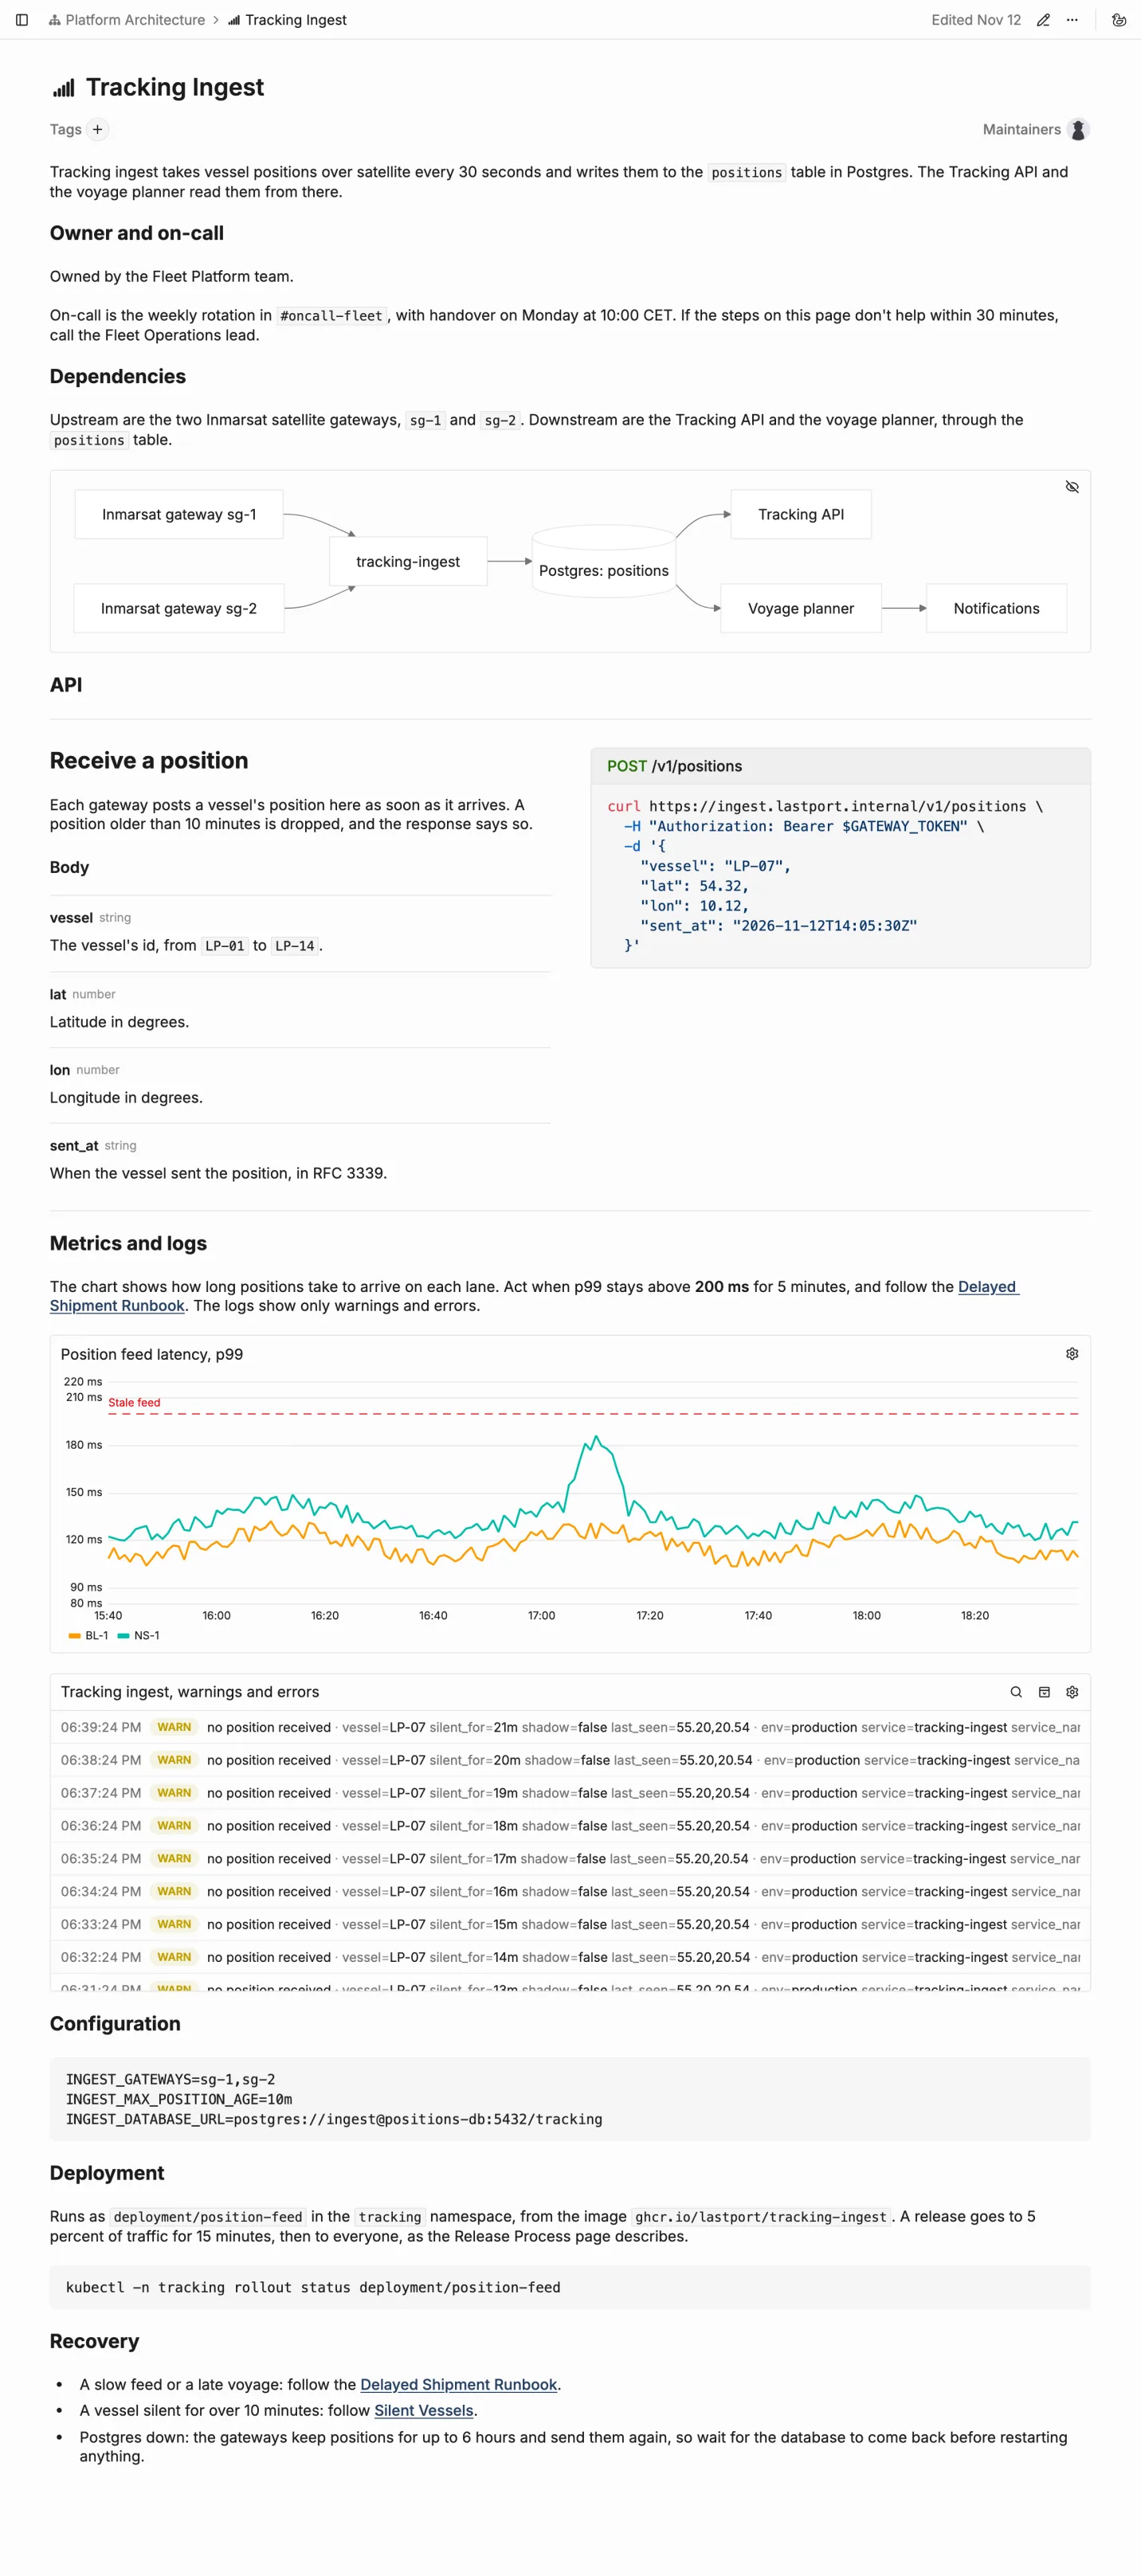
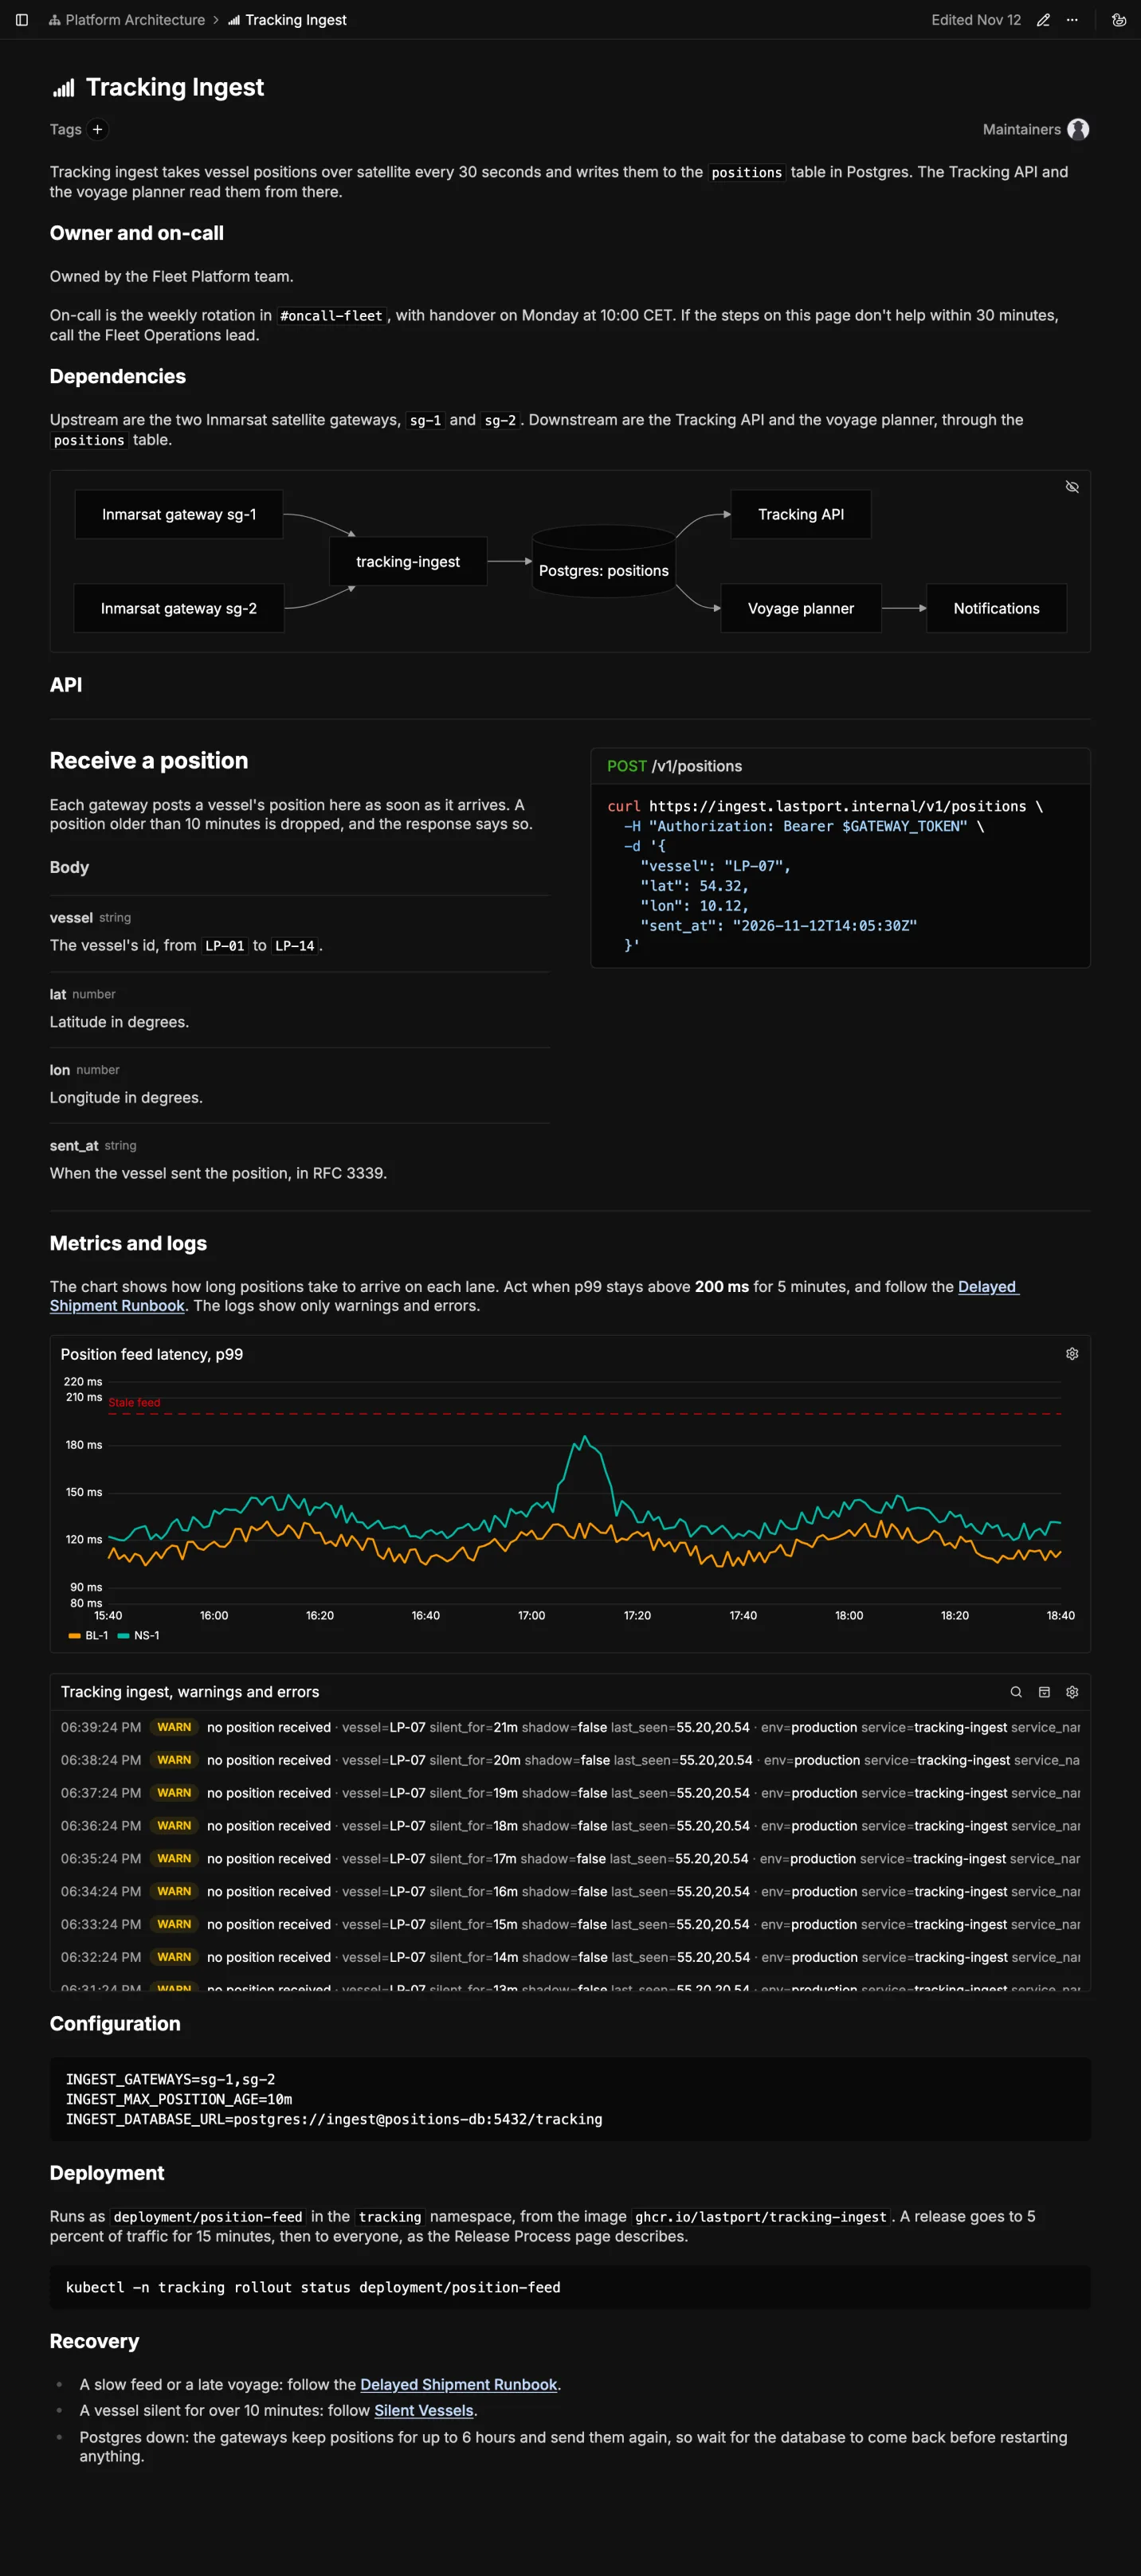 The Tracking Ingest service page, from top to bottom
One page works while the service is small. Once a section grows past a screen or two, it's often wiser to split it into pages of its own under the service page, such as one for the architecture, one for the API reference, one for observability, and a runbook for each kind of failure. The service page then keeps the owner and dependencies at the top and links to the rest. Search, reviews, and hooks work on each of those pages the same way.
Wrapping Up
A good service page says who owns the service and what it depends on at the top of the page, then how to call it, how it's doing, and how to recover it. In Oxynote, "how it's doing" is the live chart and the logs themselves, and the page tells its maintainers when something it describes changes.
A good place to start is the service other teams ask you about most. Copy the template into its page, then add the charts and logs it needs. To connect your data, see how to connect Prometheus, PostgreSQL, or Loki. For the page to follow when the service breaks, see how to write a runbook.
Oxynote is open source and runs as one Docker container: github.com/oxynote/oxynote. If you need help or have a suggestion, come talk to us on Discord.